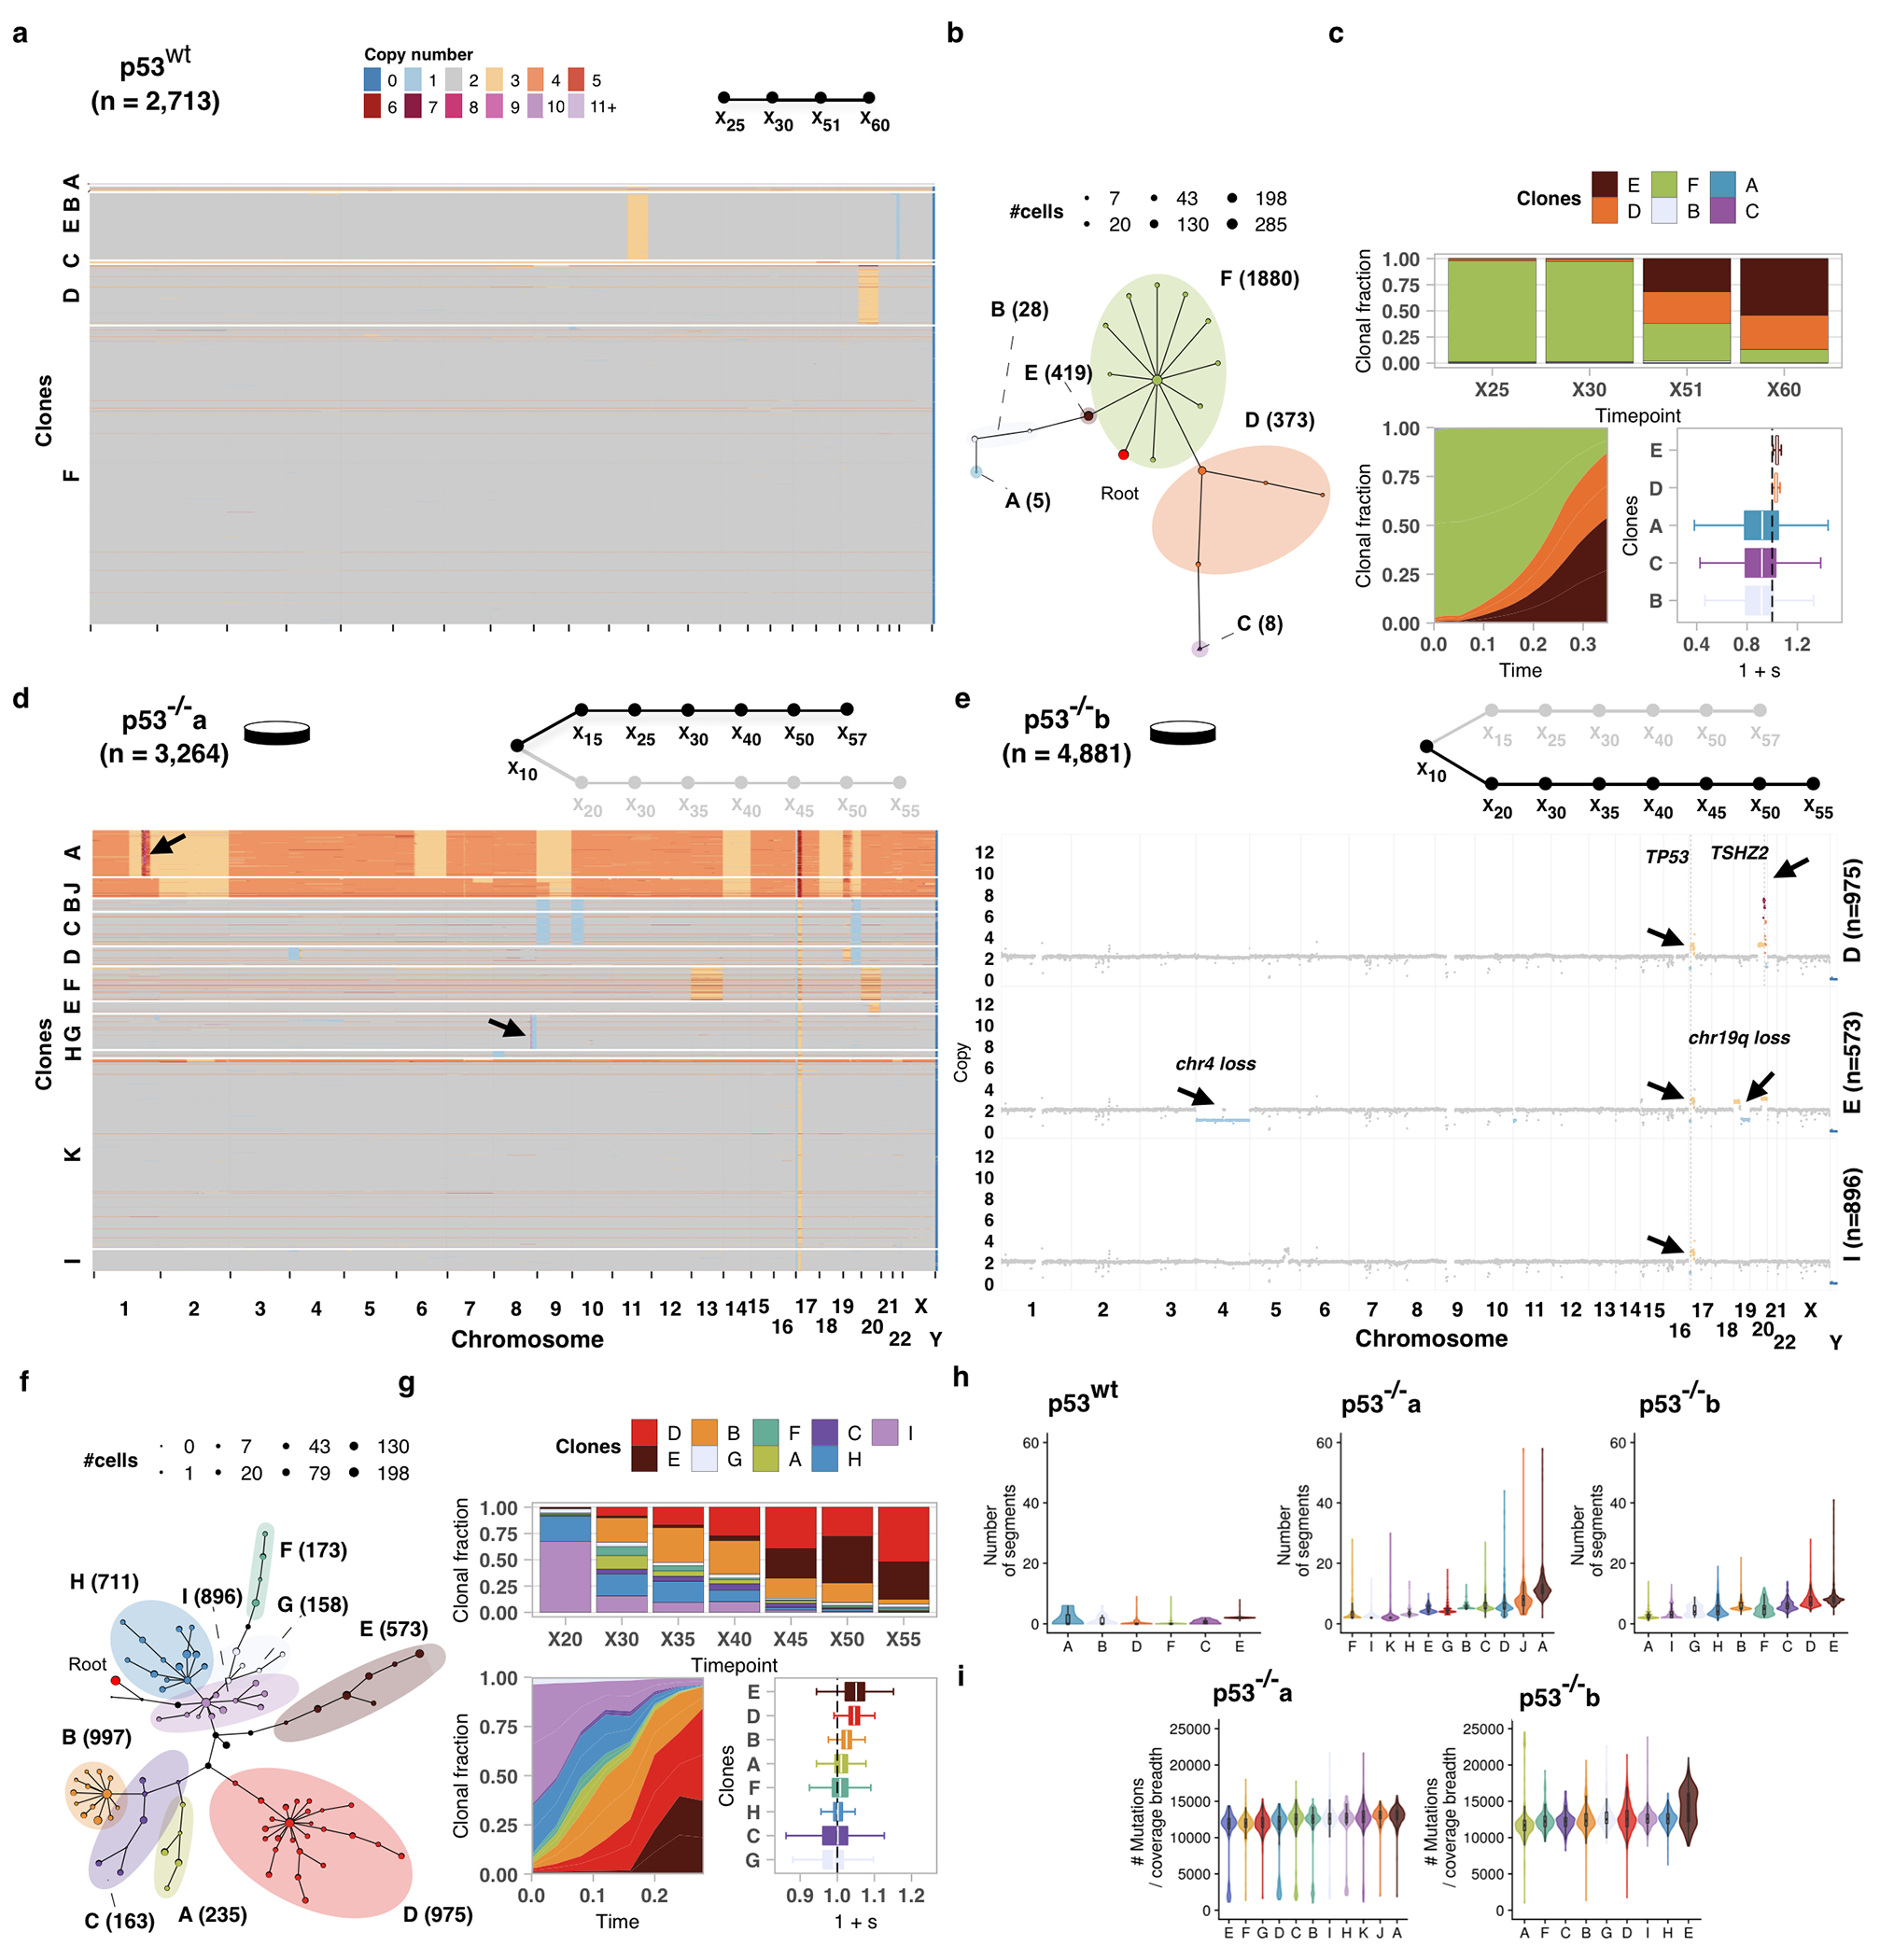
Extended Data Fig. 2.

Impact of p53 mutation on fitness in 184hTERT cells. a) Heatmap representation of copy number profiles of 2,713 p53wt cells, grouped in 6 phylogenetic clades. b) Phylogeny of cells over the timeseries p53wt where nodes are groups of cells (scaled in size by number) with shared copy number genotype and edges represent distinct genomic breakpoints. Shaded areas represent clones. Tree root is denoted by the red circle. c) Observed clonal fractions over time, inferred trajectories and quantiles of the posterior distributions over selection coefficients of fitClone model fits to p53wt with respect to the reference Clone F. d) Analogous to a but for p53−/−a (n=3,264 cells p53−/−a cells). e) Clonal genotypes of three representative clones for p53−/−b showing high level amplification of TSHZ2 in Clone D, Chr4 loss in Clone E. Reference diploid Clone I is shown for comparison. f, g) Analogous to b, c but for p53−/−b (n=4,881 p53−/−b cells; reference Clone I). h) Number of segments per clone in hTERT WT and p53−/−a and p53−/−b branches. i) Number of mutations in p53−/−a and p53−/−b branches. Boxplots are as defined in Fig. 1b.
