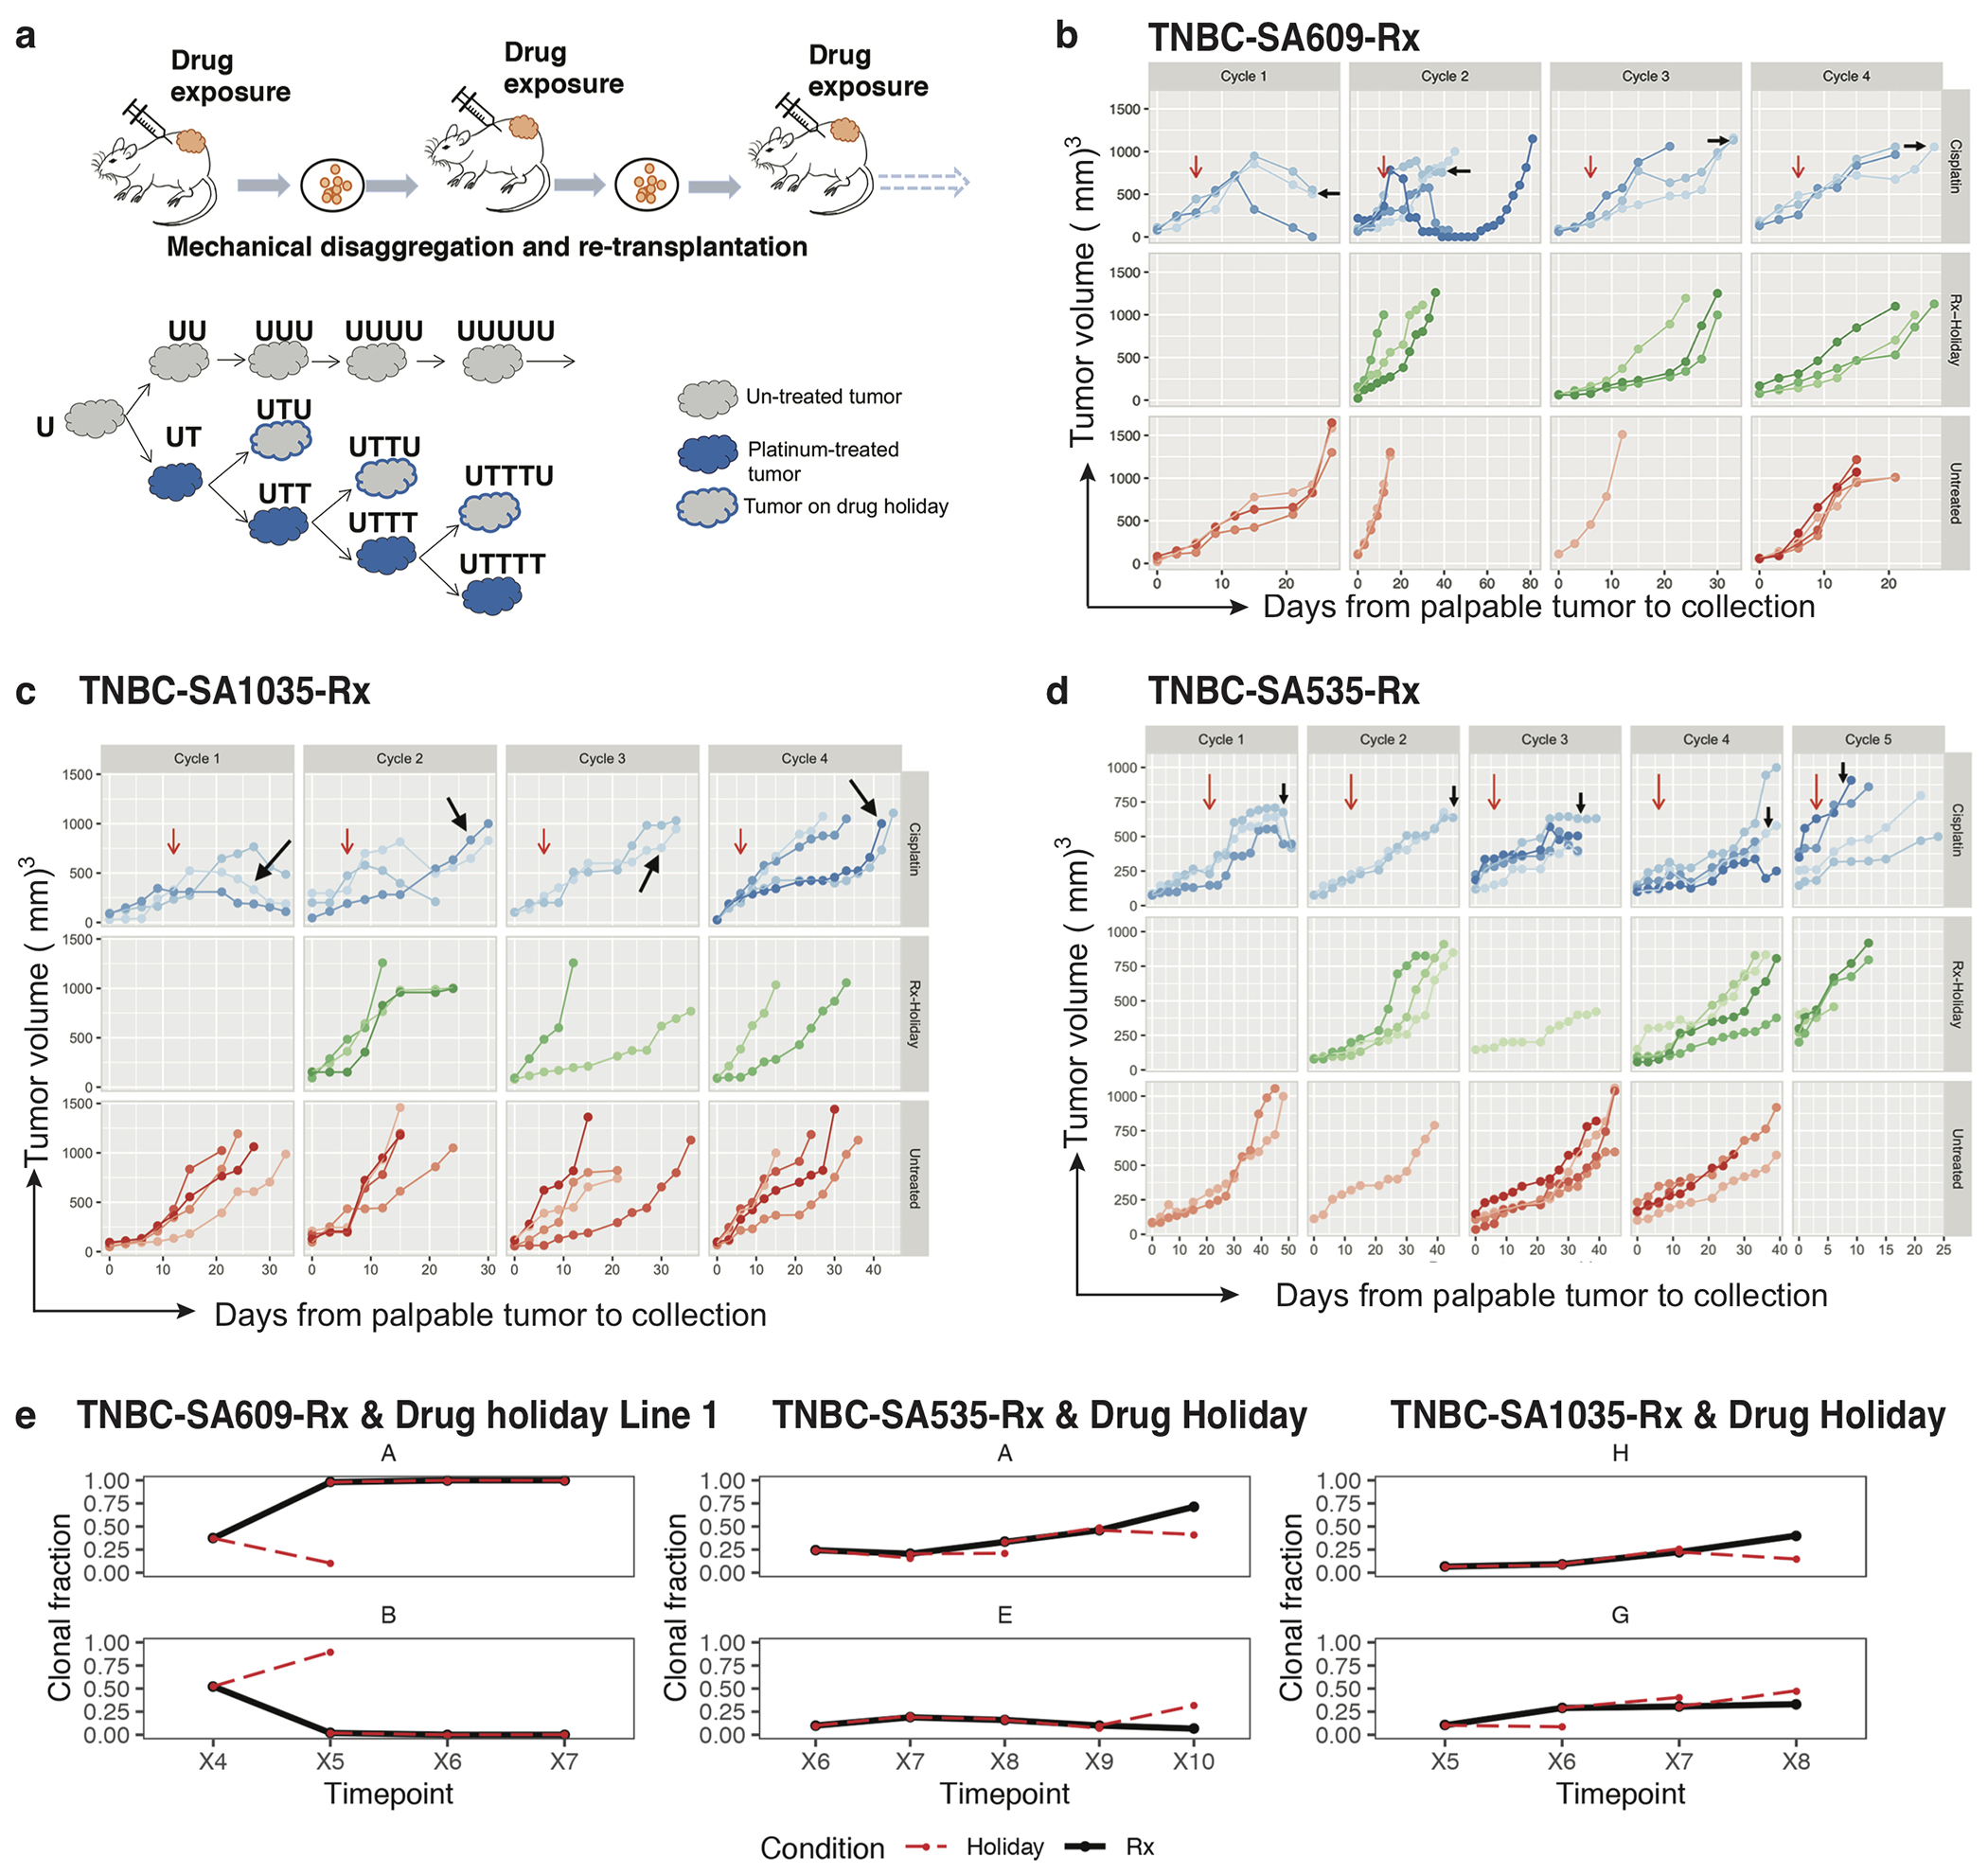
Extended Data Fig. 3.

PDXs tumour growth and clonal dynamics with cisplatin. a) Experimental design of cisplatin treatment in PDX. The solid blue colour representing cisplatin treated tumours (UT,UTT,UTTT,UTTTT); blue outlined in grey as drug holiday (UTU,UTTU,UTTTU); grey as untreated series. b-d) Tumour response curves in TNBC-SA609, TNBC-SA535 and TNBC-SA1035 treated with Cisplatin (blue), in drug Holiday (green) and untreated (red) where each tumour replicate is shown in a different shade. The vertical axis on the right denotes the status of tumours and on the left denotes the tumour volumes. The top horizontal axis represents number of cisplatin cycles and at the bottom days from palpable tumours to collection. The red arrows indicate the start of treatment and the black arrows indicate the tumour sampled for scDNAseq. The bottom horizontal axis shows the tumour passage number. Each line in the big box is an individual tumour showing the growth over time. e) (top) Clonal trajectories of the clone with the highest inferred selection coefficient in the treatment regime (solid black line) and the drug holiday counterpart (dashed red line) at each timepoint, in the three TNBC PDX timeseries; (bottom) As the top row, but for a clone that grows back in the holiday regime.
