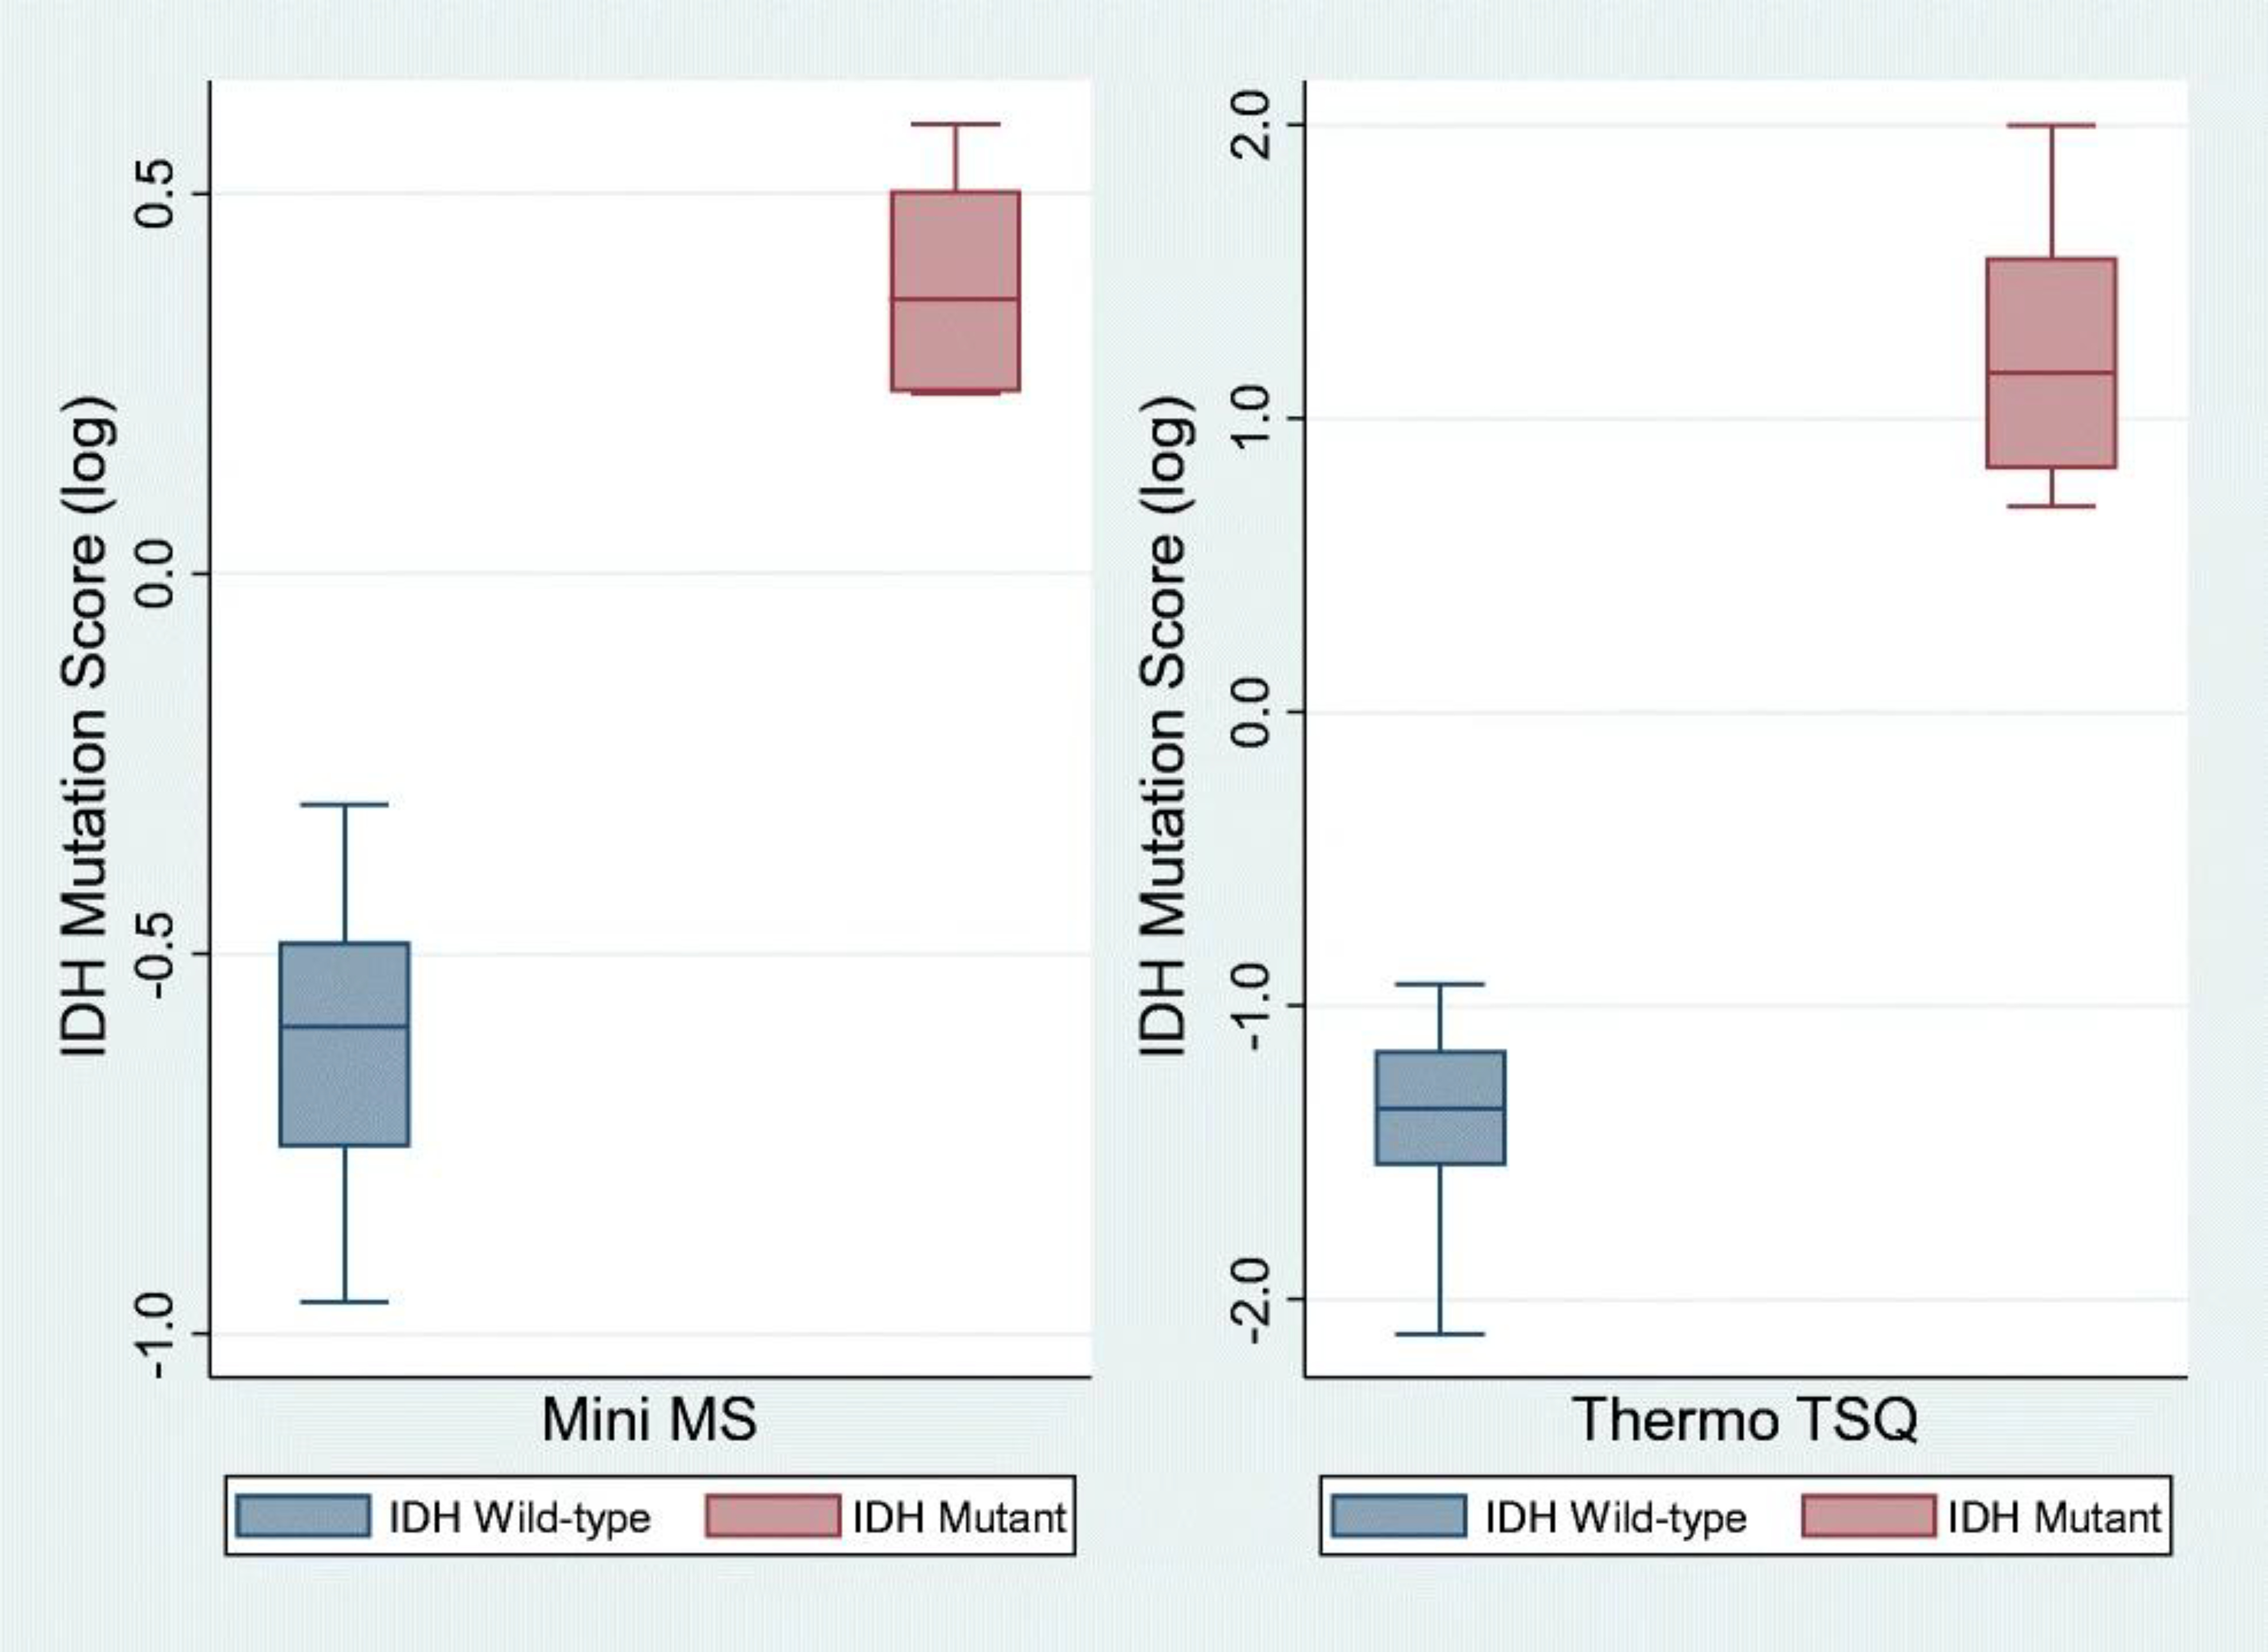
Fig. 2.

Box-and-whisker plot of IDH mutation scores in human glioma tissue specimens (n = 25) analyzed intraoperatively using a PURSPEC Mini β and in the laboratory using a Thermo Triple Quadruple TSQ. (The box represents the interquartile range with a median line and whiskers at ± 1.5 SD. Two outliers (IDH wild-type) with IDH mutation scores below 1.5 SD were excluded in the Mini MS plot. Population medians for IDH mutation scores for both methods were statistically different; p values for both are 0.0001, using the Kruskal-Wallis non-parametric test.)
