
Fig. 4.
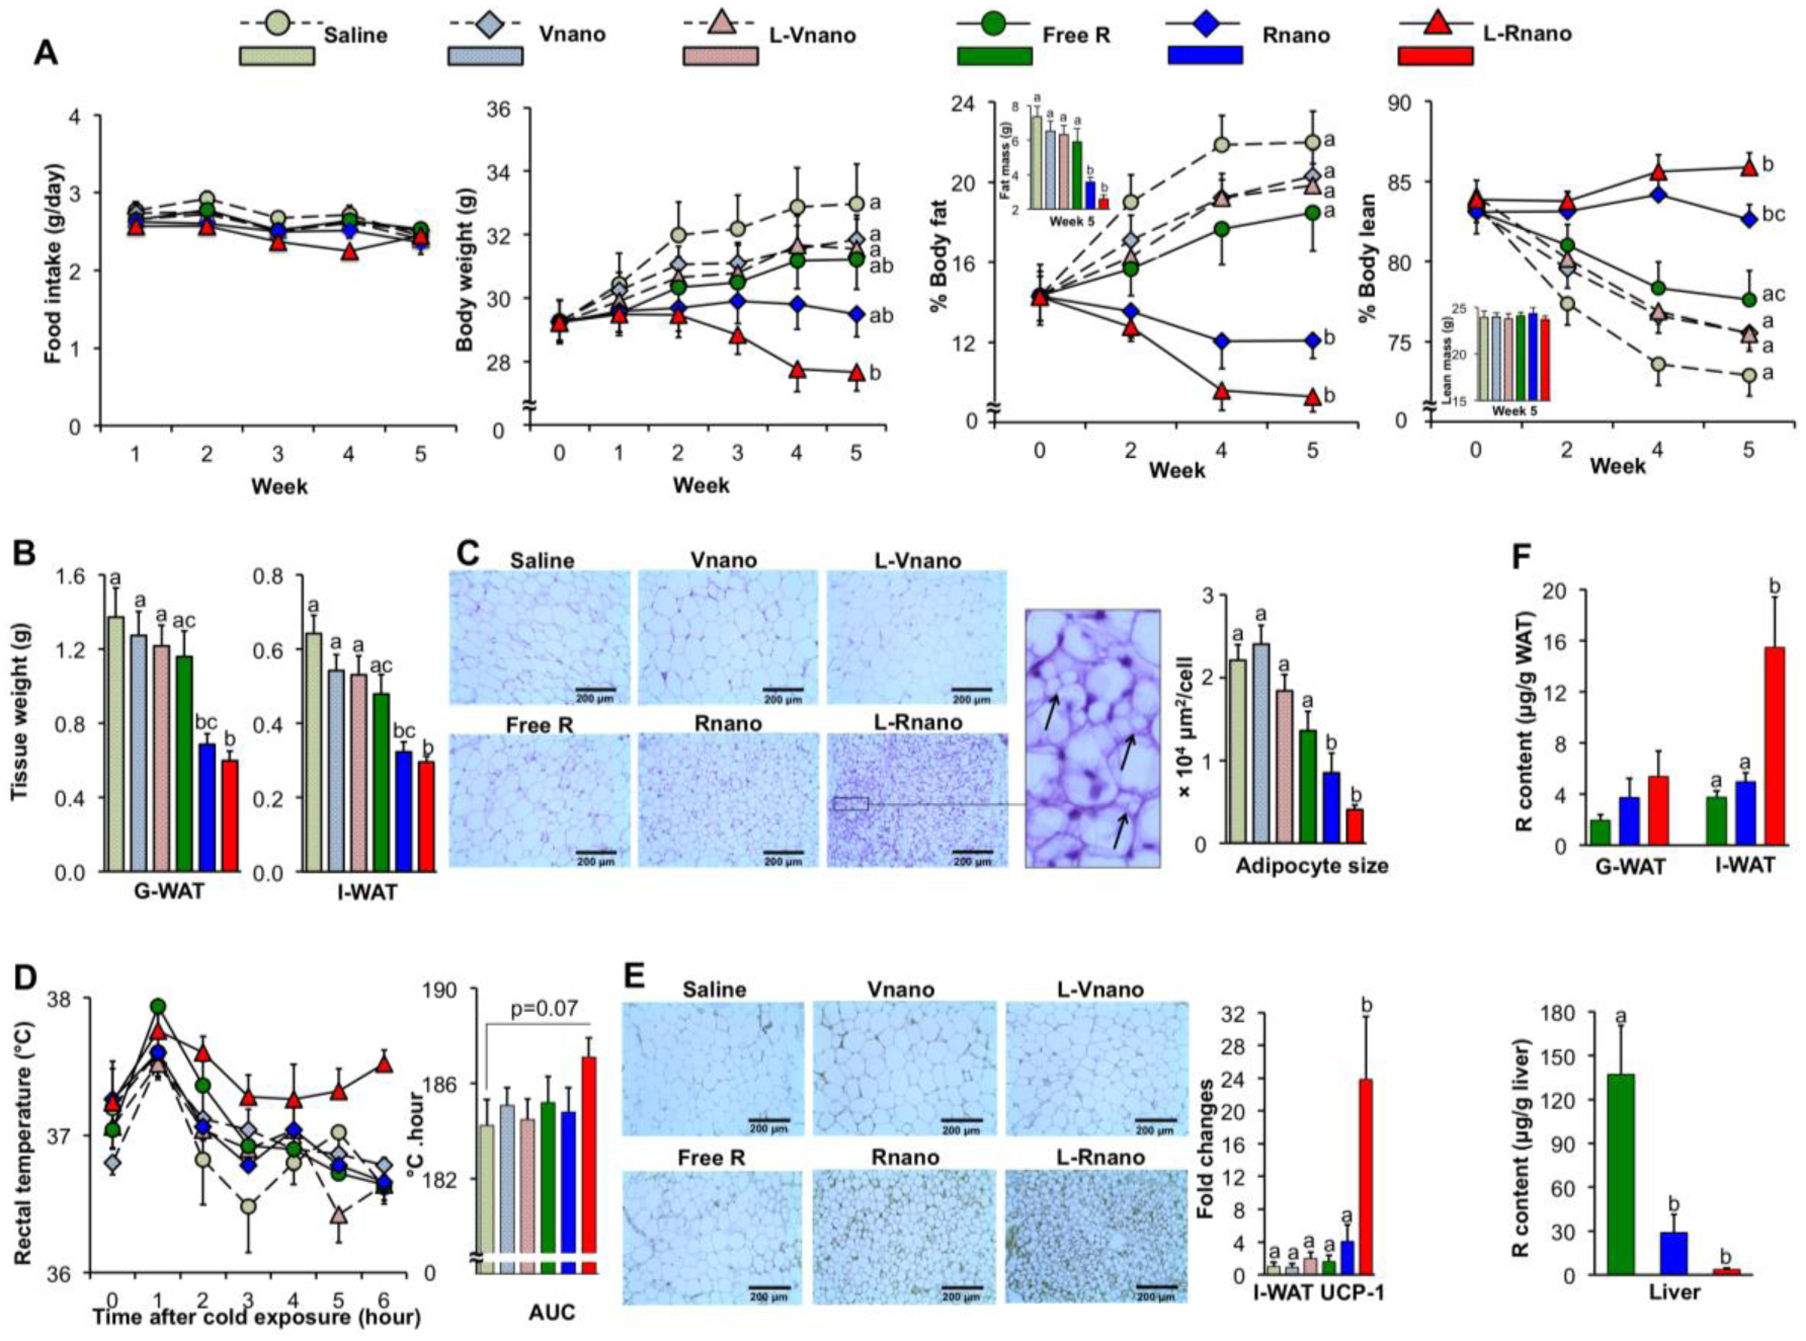
L-Rnano treat obesity via browning I-WAT in C57BL/6J mice. (A) Food intake, body weight, % body fat and % body lean of mice (n=10). (B) Weights of G-WAT and I-WAT. (C) Representative H&E histological images of I-WAT, and adipocyte sizes were quantified microscopically (n=5). Arrows show multilocular lipid droplet morphology in the I-WAT section of L-Rnano-treated mice. (D) Core body temperature changes over 6 hours of cold exposure (n=5). The temperature changes are displayed as the AUC. (E) Representative UCP-1 immunostaining images of I-WAT sections (n=5), UCP-1 mRNA expression levels in I-WAT (n=7). (F) R content in G-WAT, I-WAT and the liver (n=10). Scale bar = 200 μm. Data are expressed as mean ± SEM. Bars or lines without a common superscript differ, p<0.05 by one-way ANOVA followed by Tukey HSD Post Hoc test.