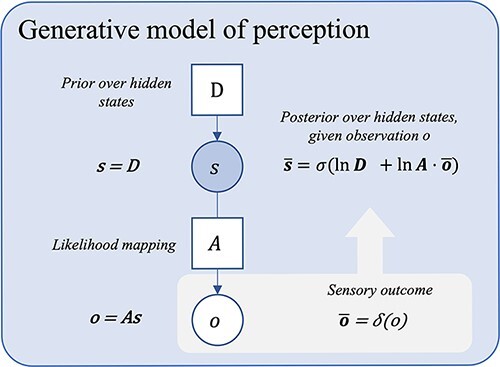
Figure 1.

A probabilistic graphical model showing a basic generative model for moment-to-moment perception. This figure depicts a simple generative model for perception. Inference here inverts the likelihood mapping from causes to their outcomes, P(o | s), using prior beliefs about states (D) and sensory data (o), to obtain (or approximate) the most probable state P(s | o). Here, Bayesian beliefs are noted in bold, bar notation represents posterior beliefs, σ is the softmax function (returning a normalized probability distribution), and δ is the Kronecker delta function (returning 1 for the observed outcome, zeros for all non-observed outcomes). o is used to denote the predictive posterior over observations, and  represents the actual observation. For the derivation of the latent state belief update equations shown, see Friston et al. (2016, Supplementary Appendix A). [Please note that, by convention in the active inference literature, the ‘dot’ notation is used to represent a backwards matrix multiplication and renormalization when applied to a matrix A of shape (m, n) and a set x of n probabilities, i.e. A· x = y, where y is a normalized set of m probabilities such that Ay = x. See Friston et al.(2017c)]. The graphical presentation was adapted from a template given in Figure 1a in the study by Hesp et al. (2021).
