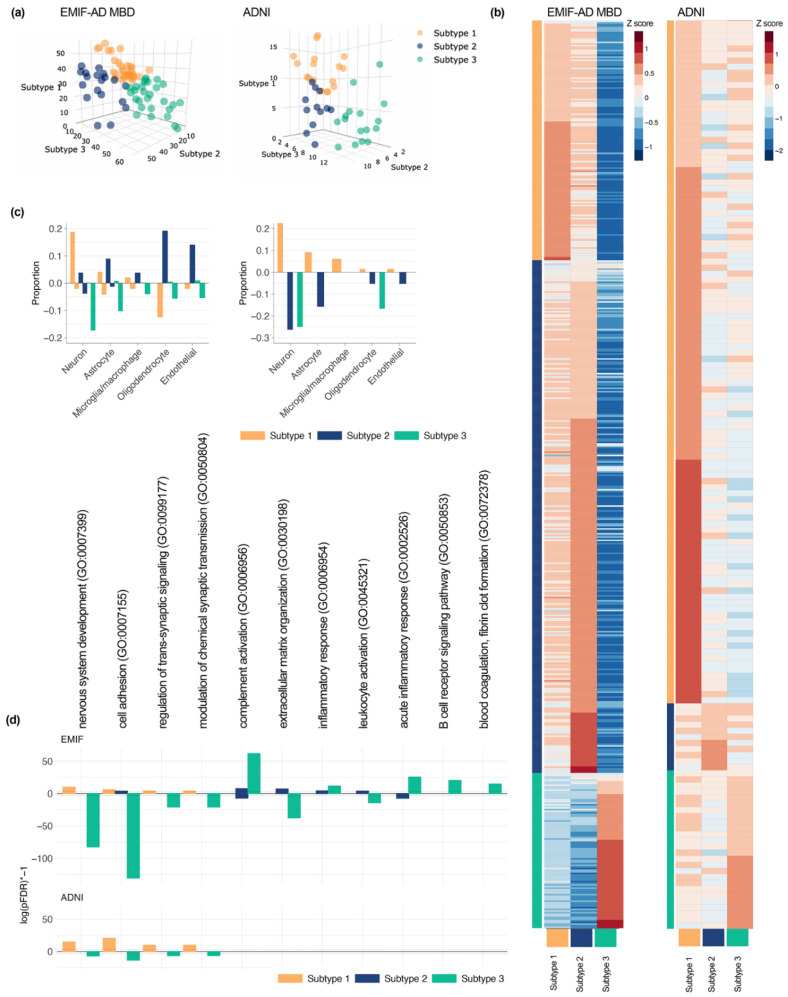
Figure 1.
(a) Subject scores which reflect how well they match each of the three subtypes, individuals were assigned to the subtype on which they showed the highest loading; (b) protein levels averaged across individuals for each subtype (see Supplementary Table S5a,b for statistics of protein level comparisons between subtypes); (c) proportion of subtype-specific proteins that were labelled to be specific for a particular cell type (left: EMIF-AD MBD; right: ADNI); (d) selection of pathways enriched for subtype-specific proteins (see Supplemental Table S6 for complete list of enriched pathways). For (c,d): bars going up represent pathways associated with increased proteins, bars going down represent pathways associated with decreased proteins, and in (d) absolute numbers represent log(pFDR) * −1, * is times.

