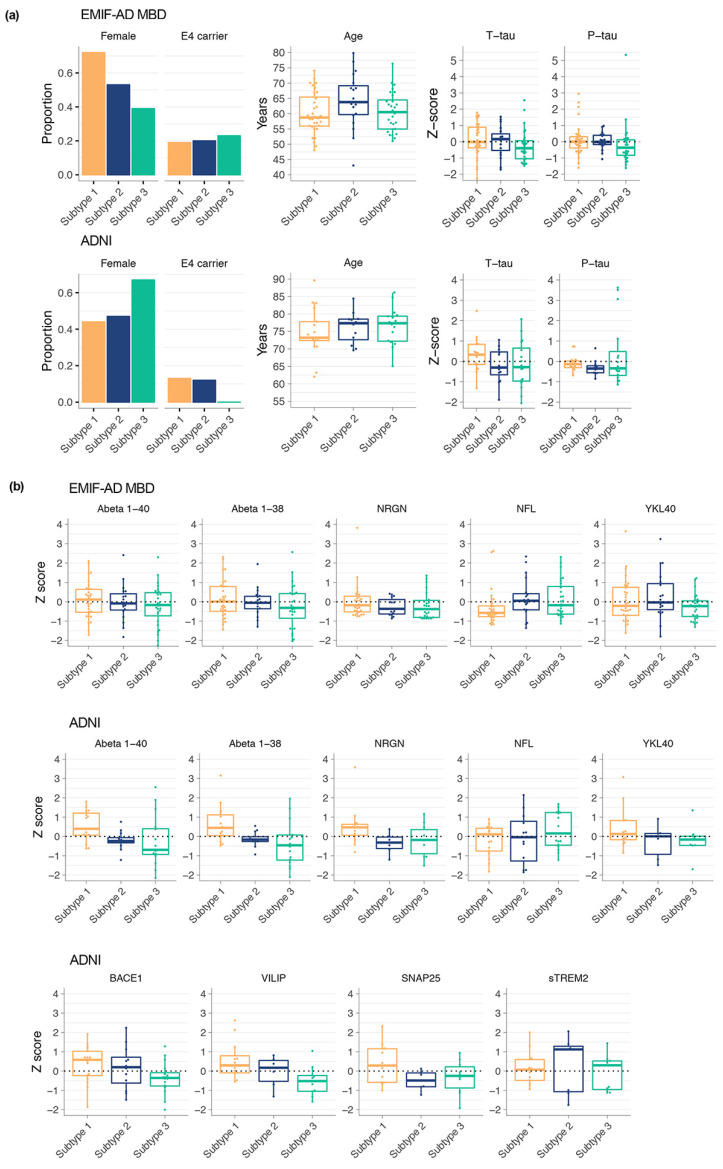
Figure 2.
Subtype comparisons on biological characteristics. (a) Comparison of subtypes for the proportion of females and APOE e4 carriers, as well as age, t-tau, and p-tau levels; (b) comparisons of subtypes on other CSF markers that were not included in clustering (see Supplemental Table S8 for statistics).

