Figure 1.
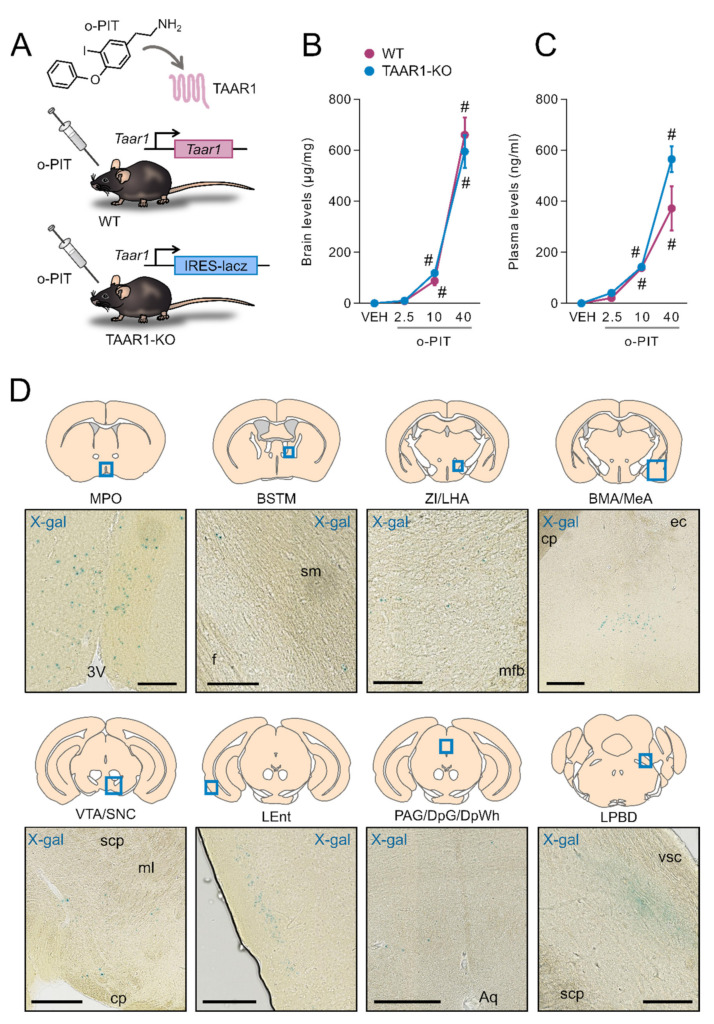
O-PIT brain and plasma pharmacokinetics in TAAR1-KO mice and TAAR1 distribution in the brain. (A) Chemical structure of o-PIT and schematic representation of the TAAR1-KO mouse genetic construct. (B–C) Levels of o-PIT were quantified in brain (B) and plasma (C) 60 min after administration. Levels are expressed as absolute values per weight of brain sample (µg/mg) and volume of plasma (ng/mL). All data are means ± SEM. N = 4–5 per group. p < 0.05, influence of treatment (#) or genotype (*). VEH: vehicle. (D) Neuroanatomical distribution of TAAR1 expressing cells using β-galactosidase detection in TAAR1-KO mice sections and that the staining represents expression under the endogenous TAAR1 promoter (N = 3). MPO: medial preoptic nucleus (scale bar: 100 μm), BSTM: medial bed nucleus of stria terminalis (scale bar: 100 μm), ZI/LHA: zona incerta/lateral hypothalamic area (scale bar: 100 μm), BM/Me: basomedial/medial amygdaloid nucleus (scale bar: 250 μm), VTA/SNC: ventral tegmental area/compact part of substantia nigra (scale bar: 250 μm), LEnt: lateral entorhinal cortex (scale bar: 250 μm), PAG/DpG/DpWh: periaqueductal grey/deep grey layer of superior colliculus/deep white layer of superior colliculus (scale bar: 250 μm), LPBD: dorsal part of lateral parabrachial nucleus (scale bar: 100 μm), 3V: 3rd ventricle, sm: stria medullaris, f: fornix, mfb: medial forebrain bundle, cp: cerebral peduncle, ec: external capsule, scp: superior cerebellar peduncle, ml: medial lemniscus, Aq: aqueduct.

