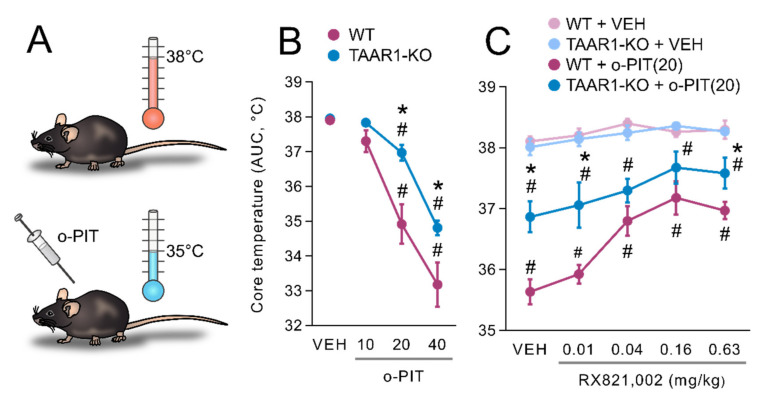
Figure 2.
Drug interaction with o-PIT upon core temperature in TAAR1-KO and WT mice. (A) Schematic depiction of hypothermic effects of o-PIT. (B) Core temperature is expressed as area under the curve (AUC) calculated over the 120 min following administration of o-PIT (2.5–40 mg/kg). (C) Antagonists (mg/kg, s.c.) were administered 30 min prior to o-PIT (20 mg/kg). Core temperature was determined 60 min following o-PIT. (C) Dose-dependent (0.01–0.63 mg/kg) effect of RX821, 002 upon the effect of o-PIT. All data are means ± SEM. N = 6–8 per group. p < 0.05, influence of treatment (#) or genotype (*). VEH: vehicle.

