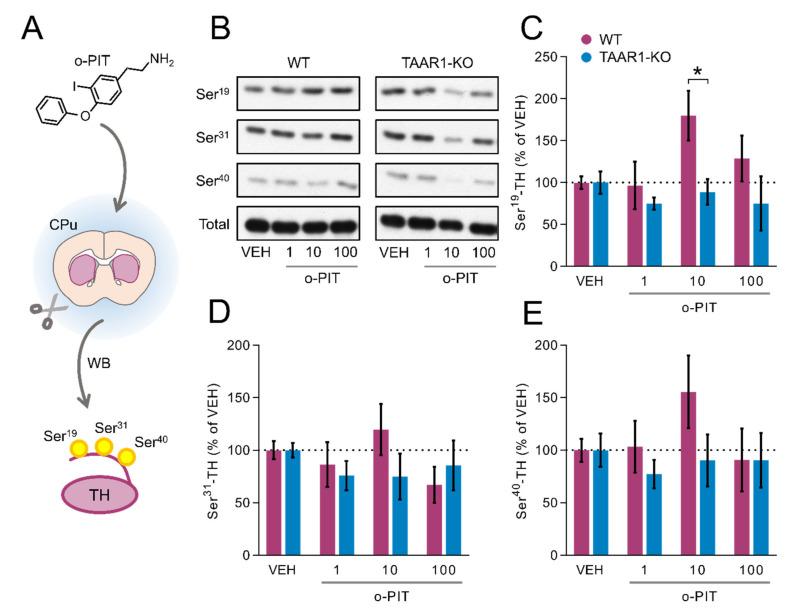
Figure 4.
Influence of o-PIT on Tyrosine Hydroxylase (TH) phosphorylation in CPu of TAAR1-KO and WT mice. (A) Schematic depiction of experimental procedure. (B) Immunoblots of P-Ser19-TH, P-Ser31-TH, P-Ser40-TH and total-TH were quantified following increasing concentrations of o-PIT (1–100 µM). (C–E) Bar graphs showing the immunoblot quantification of P-Ser19-TH (C), P-Ser31-TH (D), P-Ser40-TH (E). CPu TH activity was measured following the perfusion of 10 µM o-PIT. Data are expressed as percentage of vehicle (100%). All data are means ± SEM. N = 4–5 per group. p < 0.05, influence of treatment (#) or genotype (*). VEH: vehicle.

