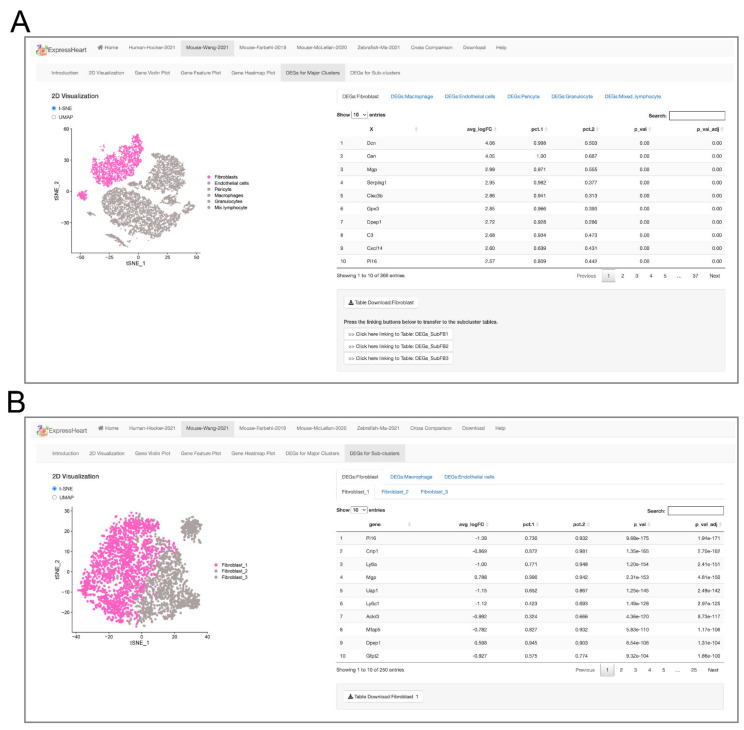
Figure 4.
Interfaces of DEG lists for (A) each major cell type versus the other cell types, and (B) each subtype versus the other subtypes the same major cell type. On the left panel of each interface, the UMAP/t-SNE plot highlighting the target major cell type (A) or subtype (B) is presented, and the corresponding DEGs are listed in a table on the right.

