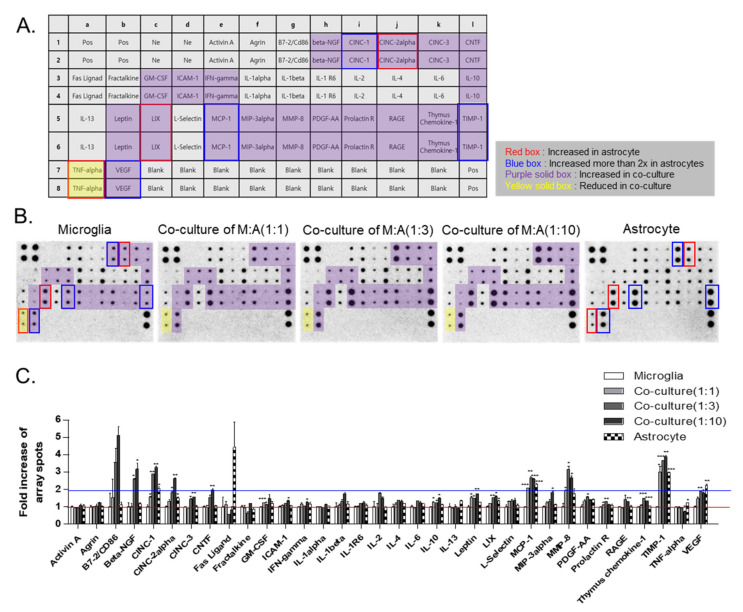
Figure 4.
The secretome analysis of single or co-culture of microglia and astrocytes with rat cytokine array: (A) cytokine array map. The array can detect 34 soluble mediators. Pos: positive control; Ne: negative control. (B) The cytokine arrays were performed with conditioned medium of microglia, astrocyte single culture, or microglia–astrocyte co-culture in various ratios. (C) The quantitative data of the fold increase in array spots between microglia, astrocyte single culture, and microglia–astrocyte co-culture. Red line: 1x baseline of array spots; Blue line: 2x baseline of array spots. * p < 0.05, ** p < 0.01, and *** p < 0.001.

