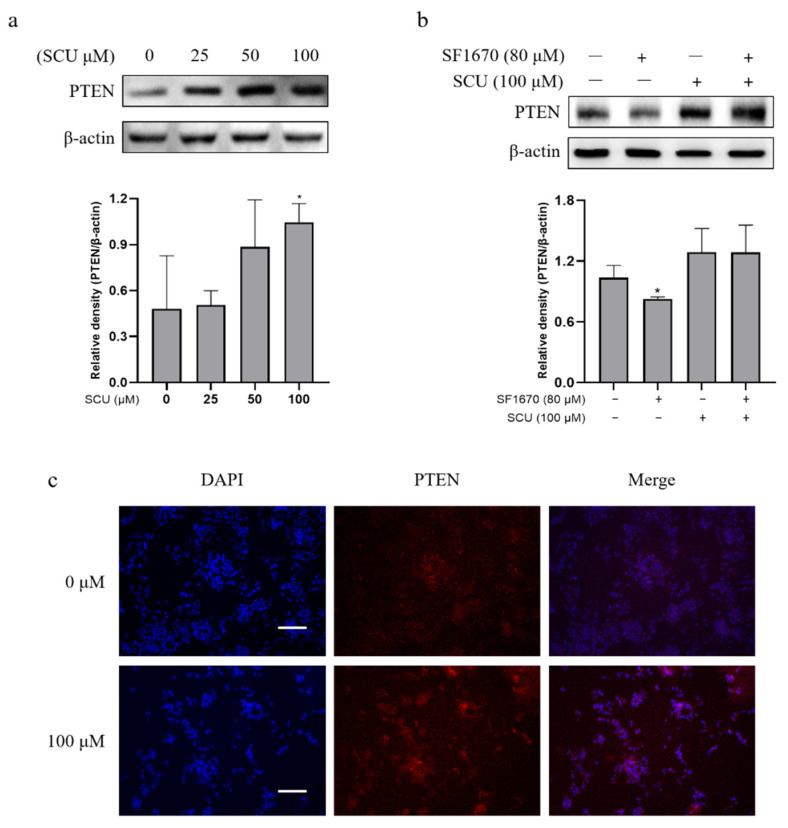
Figure 4.
Effect of SCU on PTEN expression in HepG2 cells. (a) SCU induces PTEN protein level in HepG2 cells. Cells were treated with SCU (0, 25, 50, and 100 μM) for 48 h. (b) Effect of PTEN inhibitor and SCU-induced PTEN level in HepG2 cells. Cells were treated with or without 80 μM of PTEN inhibitor: SF1670 and 100 μM of SCU for 48 h. (c) Representative immunofluorescence image images of expression of PTEN were evaluated at 0 and 100 μM (scale bars = 100 μm). The results obtained from three independent experiments were expressed as mean ± standard deviation (SD) compared with the control group. * p < 0.05.

