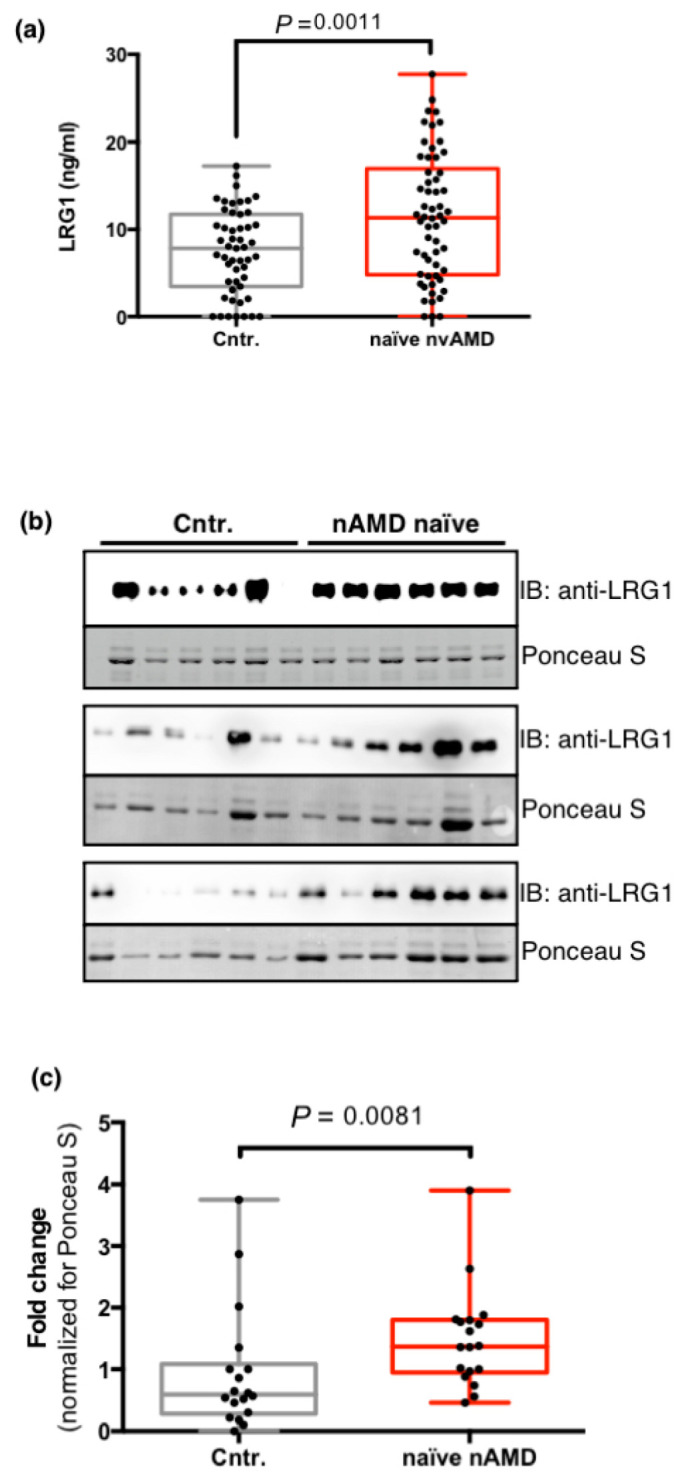
Figure 4.

Analysis of the humor aqueous levels of LRG1. (a) LRG1 protein concentrations in the aqueous humor of 58 naïve nvAMD patients (nvAMD) and 51 controls (Cntr.) (described in Table 2) were determined by ELISA. Each sample was measured twice. Data are presented as box and whisker plots displaying the median, lower, and upper quartiles (boxes) and minimum–maximum (whiskers). The P value was calculated by a two-tailed unpaired Student’s t-test. (b) Western blot analysis of LRG1 levels in the aqueous humor of 18 randomly selected nvAMD patients and controls. Loading control is shown as Ponceau S staining. (c) Quantitative analysis of panel (b) shows a significant increase in LRG1 expression in nvAMD patients. LRG1 intensity was normalized by the intensity of Ponceau-stained proteins, and protein levels were presented as fold changes. The P value was calculated by a Mann–Whitney nonparametric U test.
