Figure 1.
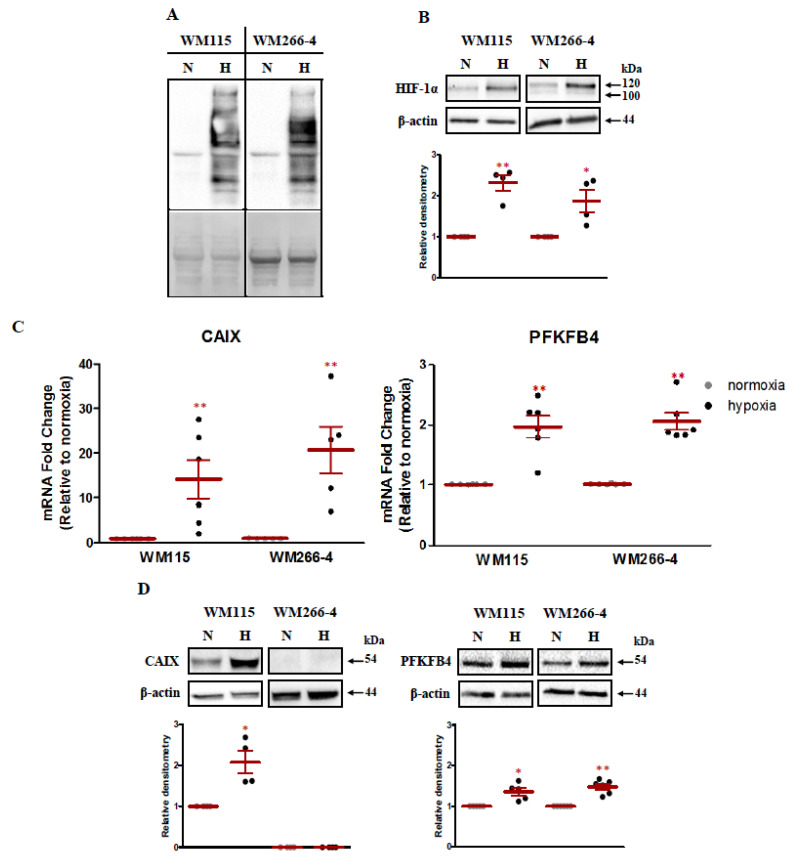
The response of malignant melanoma cells to low oxygen concentration. (A) Upper panel: Malignant melanoma lines, WM115 and WM266-4, were cultured with 100 µM pimonidazole (hypoxyprobe) in normoxic (N) and hypoxic conditions (H) for 16 h. The formation of pimonidazole–protein adducts were detected using Western Blot. Lower panel: Ponceau S stained membrane is shown as an internal control for equal protein loading. (B) Upper panels: Melanoma cells were cultured for 16 h in normoxia and hypoxia. Then HIF-1 alpha subunit accumulation was verified using the Western Blot. β-actin is shown as an internal control for equal loading. Lower panels: Densitometry analysis of Western Blot bands intensity normalized to β-actin. Relative densitometry value is the average of four independent experiments. The mean ± SEM is shown. Student’s t-test was used to evaluate the influence of hypoxia on HIF-1 alpha subunit stabilization. * p < 0.05 by Student’s t-test, ** p < 0.01 by Student’s t-test, p-value between 0.05 and 0.1 by Student’s t-test was given as an indication of the trend. (C) CAIX and PFKFB4 expression was analyzed by RT-qPCR in both melanoma cell lines under hypoxic and normoxic conditions. Expression data for each transcript was normalized to that for the reference gene TBP. Means ± SEM of at least five independent experiments are presented relative to expression in normoxic controls. The Student t-test was used to evaluate the differences between normoxic and hypoxic expression of CAIX and PFKFB4. ** p < 0.01 by Student’s t-test. (D) Upper panels: Melanoma cells were cultured for 16 h in normoxia and hypoxia. Then CAIX and PFKFB4 expression was verified using the Western Blot. β-actin is shown as an internal control for equal loading. Lower panels: Densitometry analysis of Western Blot bands intensity normalized to β-actin. Each relative densitometry value is the average of at least four independent experiments. The mean ± SEM is shown. Studen’st t-test was used to evaluate the influence of hypoxia on CAIX and PFKFB4 expression. * p < 0.05 by Student’s t-test, ** p < 0.01 by Student’s t-test, p-value between 0.05 and 0.1 by Student’s t-test was given as an indication of the trend.

