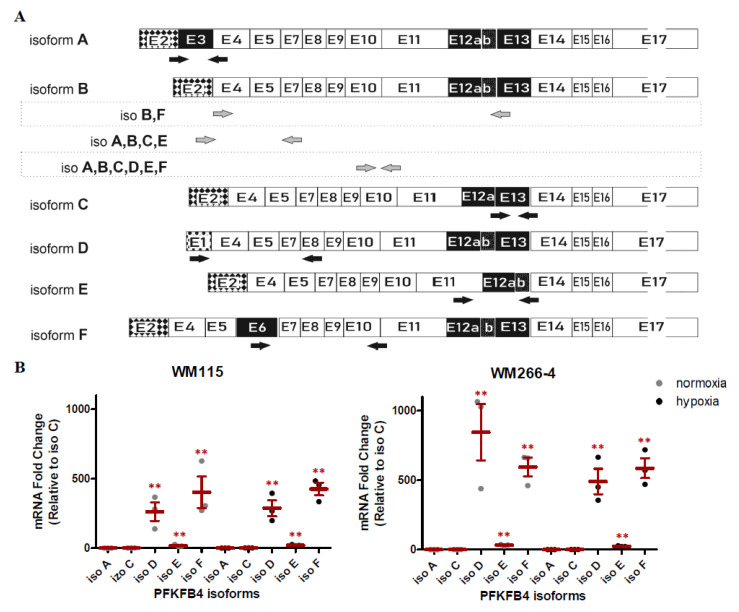
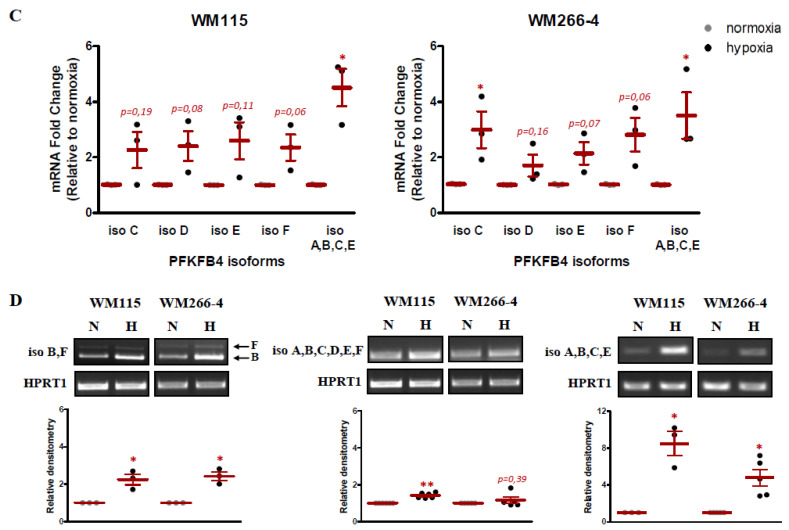
Figure 3.
Expression of PFKFB4 isoforms in normoxic and hypoxic conditions. (A) The binding position of primers specific to PFKFB4 isoforms. (B) Expression of PFKFB4 isoforms: A, C, D, E, and F under normoxic and hypoxic conditions. The expression levels of all isoforms were normalized with respect to isoform C and the fold change values were calculated. The mean ± SEM is shown of three independent experiments. Student’s t-test was used to evaluate the statistical significance. * p < 0.05 by Student’s t-test, ** p < 0.01 by Student’s t-test. (C) The influence of 16 h hypoxia on indicated isoforms expression were assessed using RT-qPCR. Expression data for each transcript was normalized to that for the reference gene β-actin, then the expression level of each isoform under hypoxia was normalized with respect to normoxia, and the fold change values were calculated. The mean ± SEM is shown of three independent experiments. Student’s t-test was used to evaluate the statistical significance. * p < 0.05 by Student’s t-test, ** p < 0.01 by Student’s t-test, p-value between 0.05 and 0.1 by Student’s t-test was given as an indication of the trend. (D) The influence of hypoxia on the expression of PFKFB4 isoforms including isoform B. The expression levels of indicated PFKFB4 isoforms were assessed using semi-quantitative RT-PCR. HPRT1 was used as an internal control for equal loading. Lower panel: Densitometry analysis of semi-quantitative RT-PCR bands intensity normalized to HPRT1. Each relative densitometry value is the average of at least three independent experiments. The mean ± SEM is shown. Student’s t-test was used to evaluate the influence statistical significance. * p < 0.05 by Student’s t-test, ** p < 0.01 by Student’s t-test, p-value between 0.05 and 0.1 by Student’s t-test was given as an indication of the trend.


