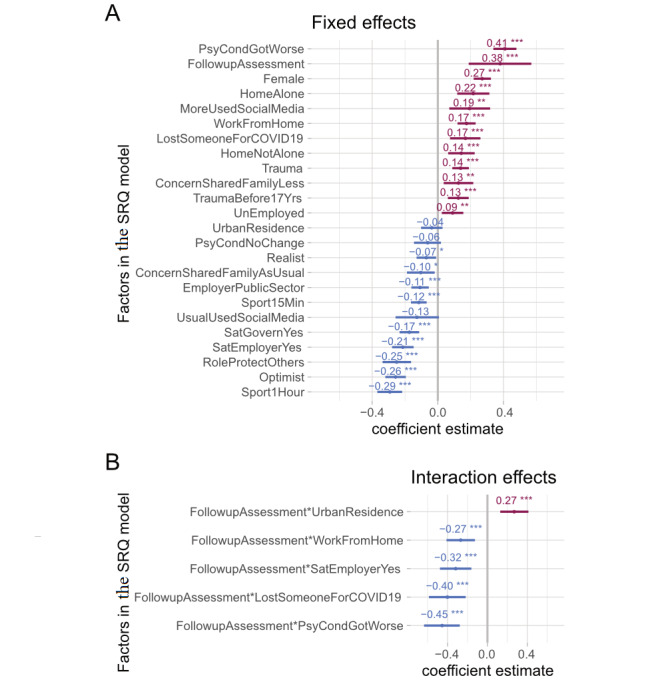
Figure 4.

Factors associated with general psychological disturbance in the second assessment. These foster plots show the mean estimates and the 95% CIs for adjusted coefficients affecting the Self-Reporting Questionnaire-20 (SRQ) generated through multiple regression. Panel A shows fixed factors for SRQ scores during the second assessment. Panel B indicates interaction terms included in our regression model, indicating a significant difference between the fixed effects and SRQ scores during the first phase of the data collection and the second assessment. Factors increasing the SRQ score are shown in red, and factors decreasing the SRQ score are shown in blue.
