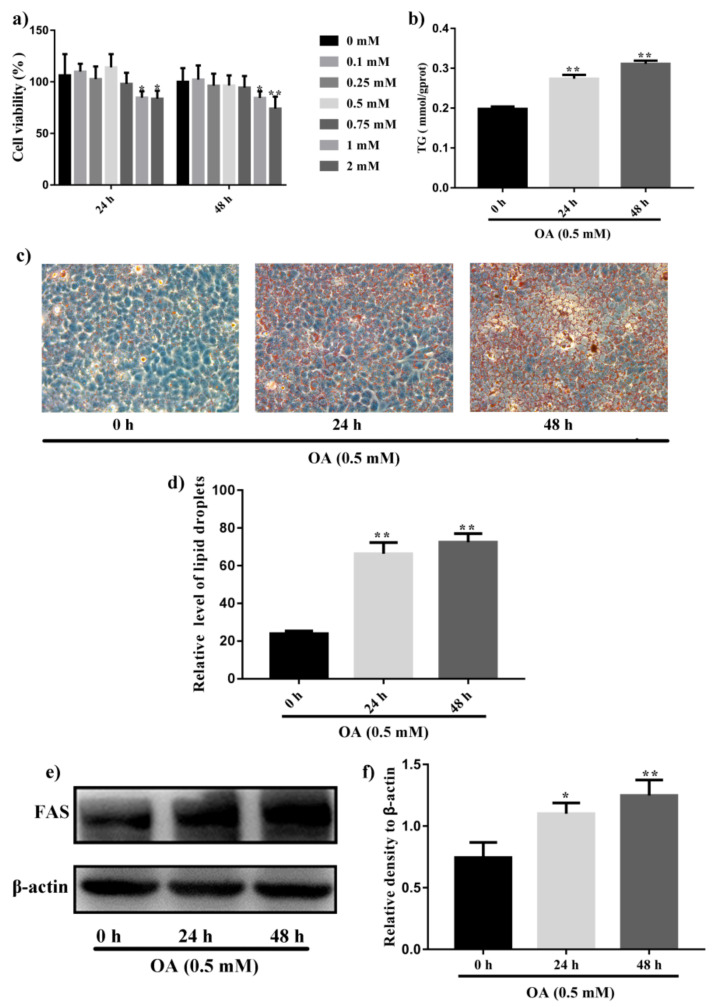
Figure 1.
Induction of steatosis by OA in HepG2 cells. (a) SRB assay of cell viability of HepG2 cells treated with different concentration of OA for 24 h and 48 h. (b) Measurement of intracellular TG contents in HepG2 cells after incubation with 0.5 mM OA for 24 h and 48 h. (c) Oil red O staining to detect intracellular lipid droplets in HepG2 cells after treatment with 0.5 mM OA for 24 h and 48 h. (d) Quantitative analysis of intracellular lipid droplets accumulation in HepG2 cells. (e) Western blot analysis of expression of FAS in HepG2 cells after treatment with 0.5 mM OA for 24 h and 48 h. (f) Quantification results of the expression of FAS. Data were expressed as Mean ± SD of three independent experiments (n = 3). * p < 0.05 and ** p < 0.01, compared with HepG2 cells without OA treatment (0 h).

