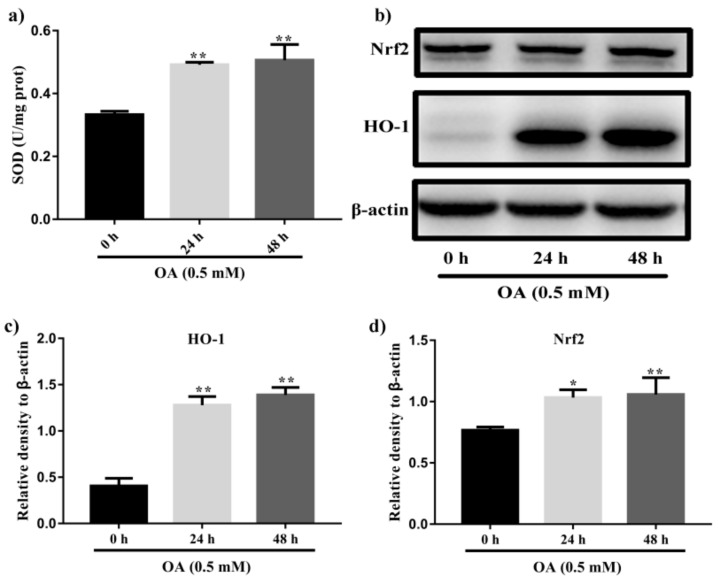
Figure 2.
Induction of steatosis by OA in HepG2 cells. (a) Measurement of levels of SOD in HepG2 cells after incubation with 0.5 mM OA for 24 h and 48 h. (b) Western blot analysis of expression of Nrf2 and HO-1 in HepG2 cells after treatment with 0.5 mM OA for 24 h and 48 h. (c) Quantification results of the expression of HO-1. (d) Quantification results of the expression of Nrf2. Data were expressed as Mean ± SD of three independent experiments (n = 3). * p < 0.05 and ** p < 0.01, compared with HepG2 cells without OA treatment (0 h).

