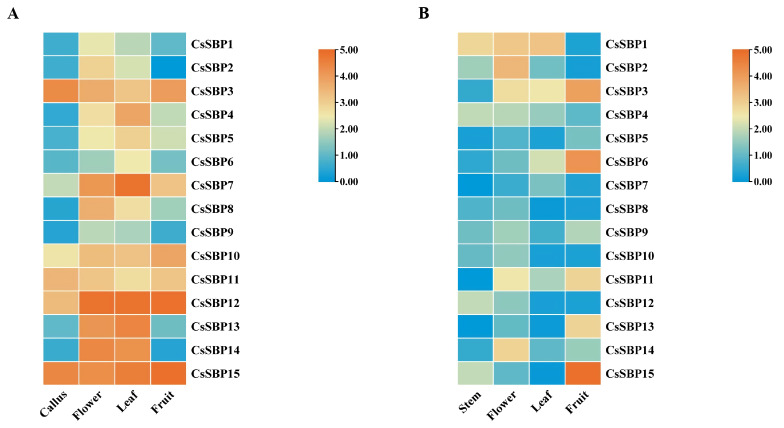
Figure 7.
Heatmap showing the expression of CsSBP genes in different tissues. (A) Gene expression in the RNA-seq Data. (B) qRT-PCR analysis of CsSBP genes expression in different tissues. The log2 fold change values were used to generate heat maps. Color gradient from orange to blue indicates that expression values change from high to low.

