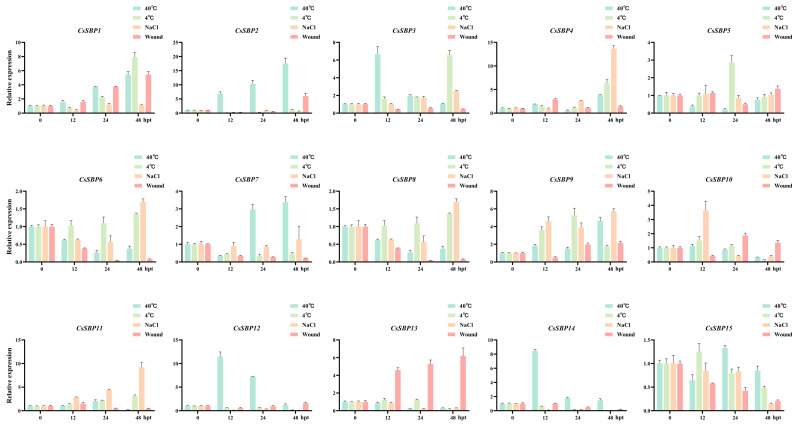
Figure 8.
Expression levels of CsSBP genes under abiotic stress treatment. The Y-axis indicates the relative expression level; X-axis (0, 12, 24, and 48 hpt) indicates hours post abiotic stress treatment. Different colors represent different stress treatments. The standard errors are plotted using vertical lines. The experiments in all panels were repeated three times with similar results.

