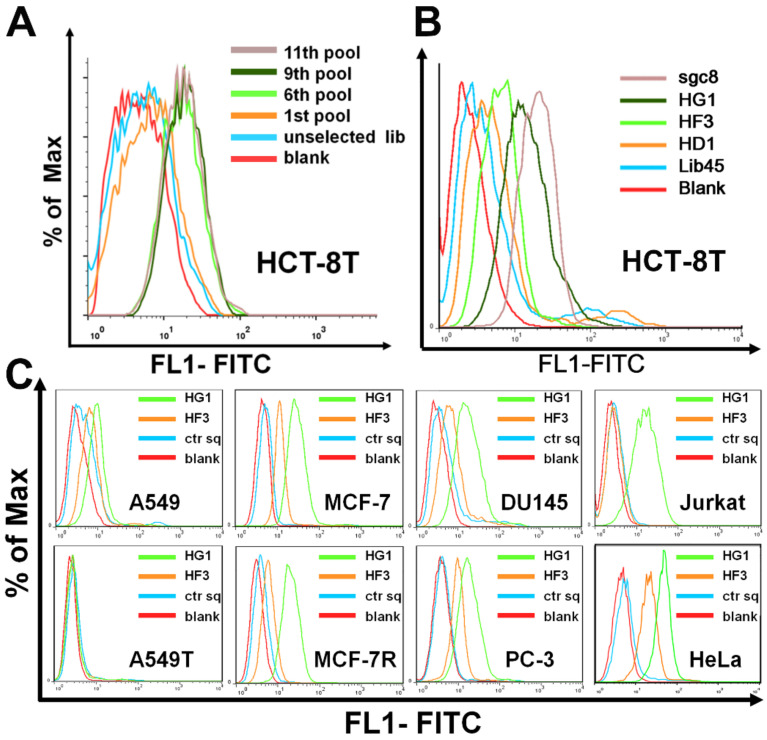
Figure 1.
Monitoring the enrichment of cell-SELEX process. (A) Histogram of fluorescence intensity of enriched ssDNA pool on HCT-8T cells by flow cytometry, unselected DNA library was used as the negative control. (B) Histogram of fluorescence intensity of DNA sequences HG1, HD1, and HF3 on HCT-8T cells by flow cytometry, Lib45 was used as the negative control and PTK7-targeted aptamer sgc8 was the positive control. (C) Flow cytometry analysis of HG1 and HF3 binding to 8 different cell lines (A549, A549T, MCF-7, MCF-7R, DU145, PC-3, Jurkat, and HeLa cells). The ctr sq was as negative control.

