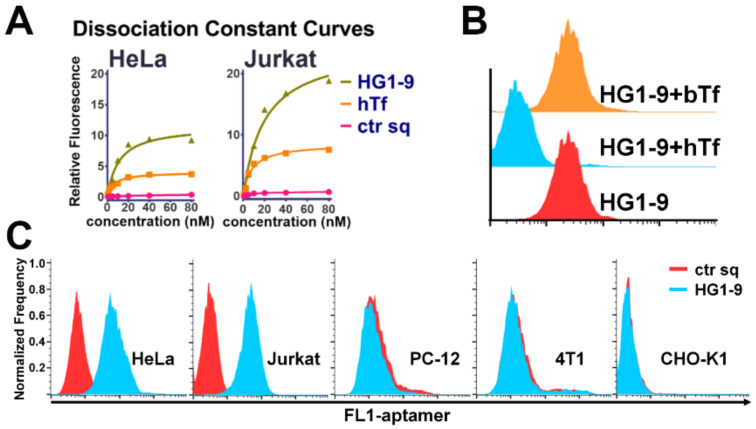
Figure 5.
Comparison of hTf and aptamer HG1-9. (A) The dissociation constant curves of HG1-9 (labeled by FITC) and hTf (labeled by FITC) to Jurkat and HeLa cells, ctr sq was as the negative control. (B) Binding ability of HG1-9 (labeled by FITC, 200 nM) to HeLa cells under the competition of bovine Transferrin (bTf, 500 nM) or human Transferrin (hTf, 500 nM). (C) The binding of HG1-9 to human cancer cell lines (HeLa and Jurkat), and other cell lines (PC-12 (Rat adrenal pheochromocytoma), 4T1 (Mouse mammary carcinoma), and CHO-K1 (a subclone of Chinese hamster ovary cell)).

