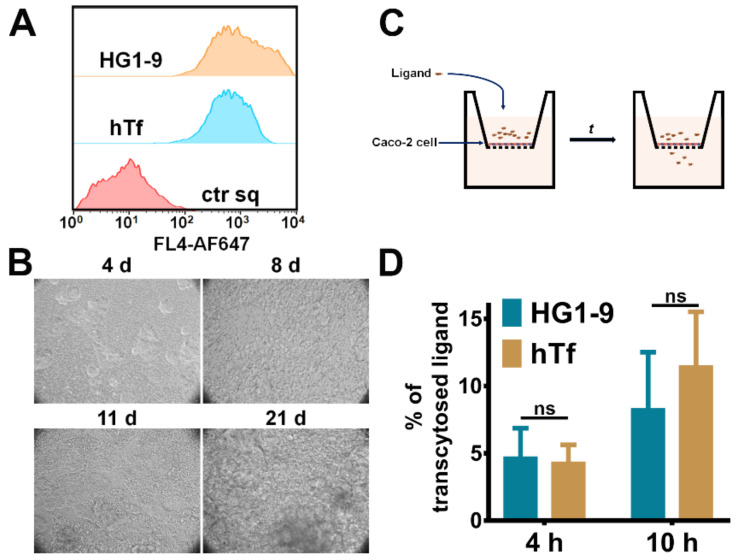
Figure 6.
The transcytosis of aptamer HG1-9 across epithelium barrier. (A) Flow cytometry analysis of aptamer HG1-9 and hTf binding to Caco-2 cells at 4 °C. ctr sq was the negative control. All of the DNA sequences and proteins were labeled by AF647. (B) The monolayer of Caco-2 cells on Transwell plate at different cultured days. (C) The schematic diagram of transcytosis of HG1-9 and hTf in Caco-2 cells. (D) Histogram of transcytosis efficiencies of HG1-9 and hTf in Caco-2 cells after incubation for 4 and 10 h. All data were presented as mean ± SE, n = 4, t-test, ns, not significant.

