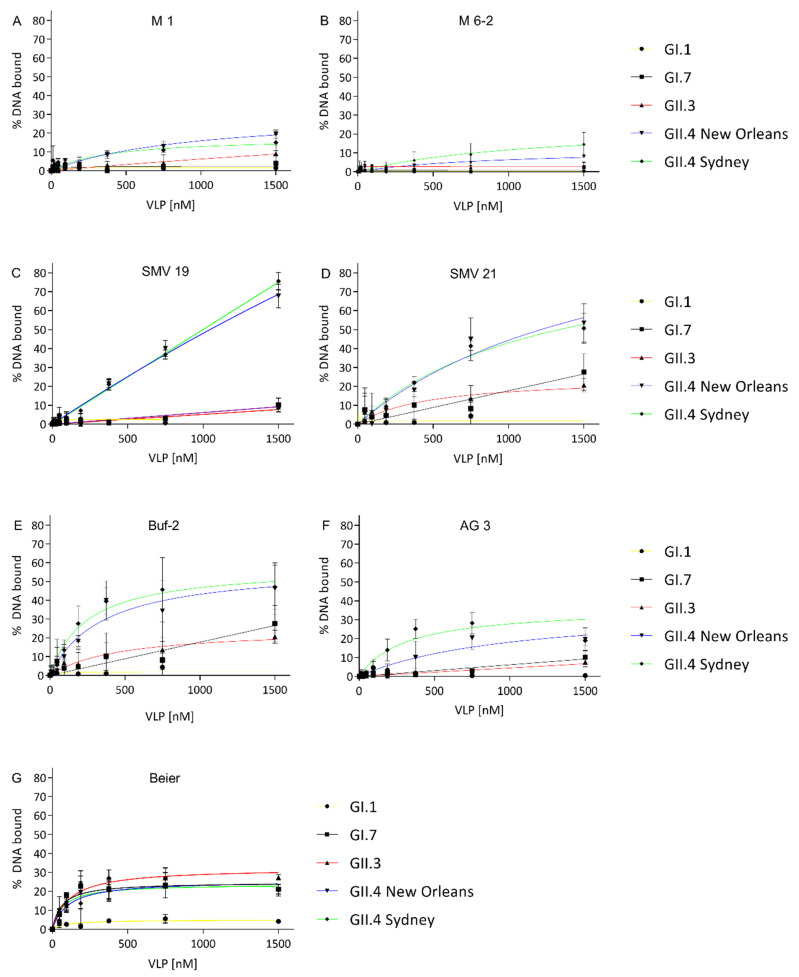
Figure 1.
VLP-binding graphs of aptamers M1 (A), M6-2 (B), SMV19 (C), SMV21 (D), Buf-2 (E), AG3 (F) and Beier (G). The different curves represent the NoV VLP genotypes GI.1 (yellow), GI.7 (black), GII.3 (red), GII.4 New Orleans (blue), and GII.4 Sydney (green). All graphs are shown with the y-axes indicating bound DNA to target protein from 0 to 80% to allow uniform evaluation of the graphs.

