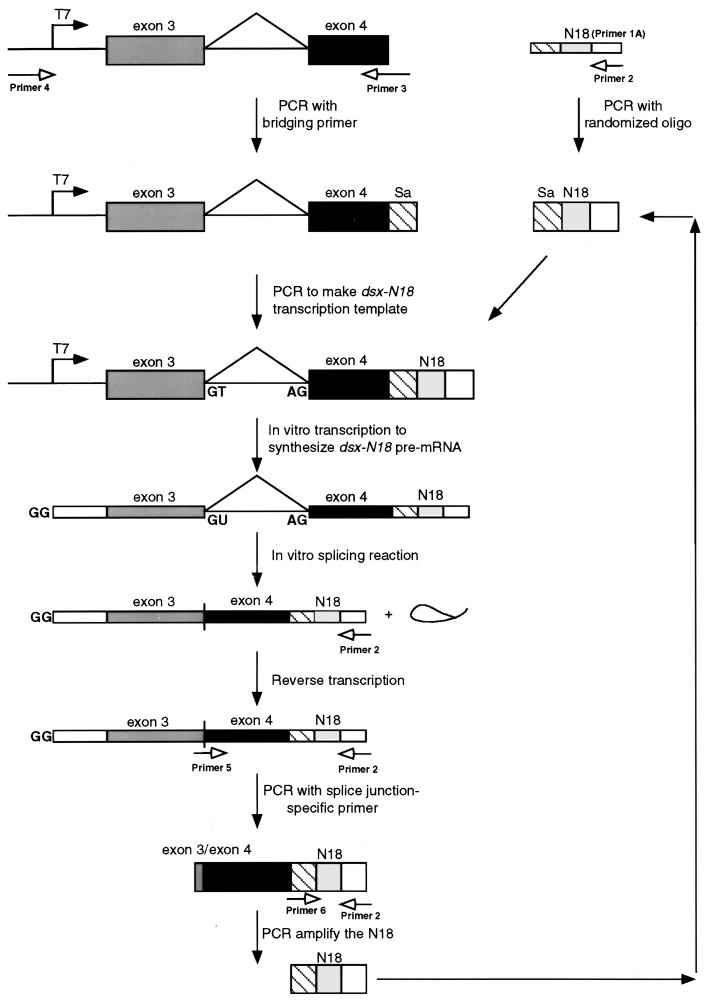
FIG. 1.
Schematic diagram of the in vitro selection strategy used to identify splicing enhancer sequences. The diagram illustrates the strategy used to construct the dsx-N18 transcription template, transcribe the dsx-N18 pre-mRNA, splice the dsx-N18 substrate in vitro, isolate the functional N18 splicing enhancers, and regenerate the transcription template for subsequent rounds of selection (see Materials and Methods for details). Boxes represent exon sequences, and horizontal lines represent intron sequences (including the branched, excised lariat). Thick boxes represent double-stranded nucleic acids (PCR template, transcription templates, and PCR products), and thin boxes represent single-stranded nucleic acids (DNA oligonucleotides, RNAs, and cDNAs). Solid arrows represent sequential steps in the construction, processing, and regeneration of the DNA and RNA molecules used in the dsx-N18 selection. Unfilled arrows indicate PCR primers (see Materials and Methods for sequences) and their sites of hybridization. In the dsx-N18 construct, the N18 enhancer is positioned at +90 relative to the dsx weak 3′ splice site. The 5′ cap, 5′ splice site, and 3′ splice site in the pre-RNAs are indicated by GG, GU, and AG, respectively. The line connecting the exons indicates the splicing pattern of the female-specific dsx IVS3 minigene upon activation by a splicing enhancer.

