Figure 4.

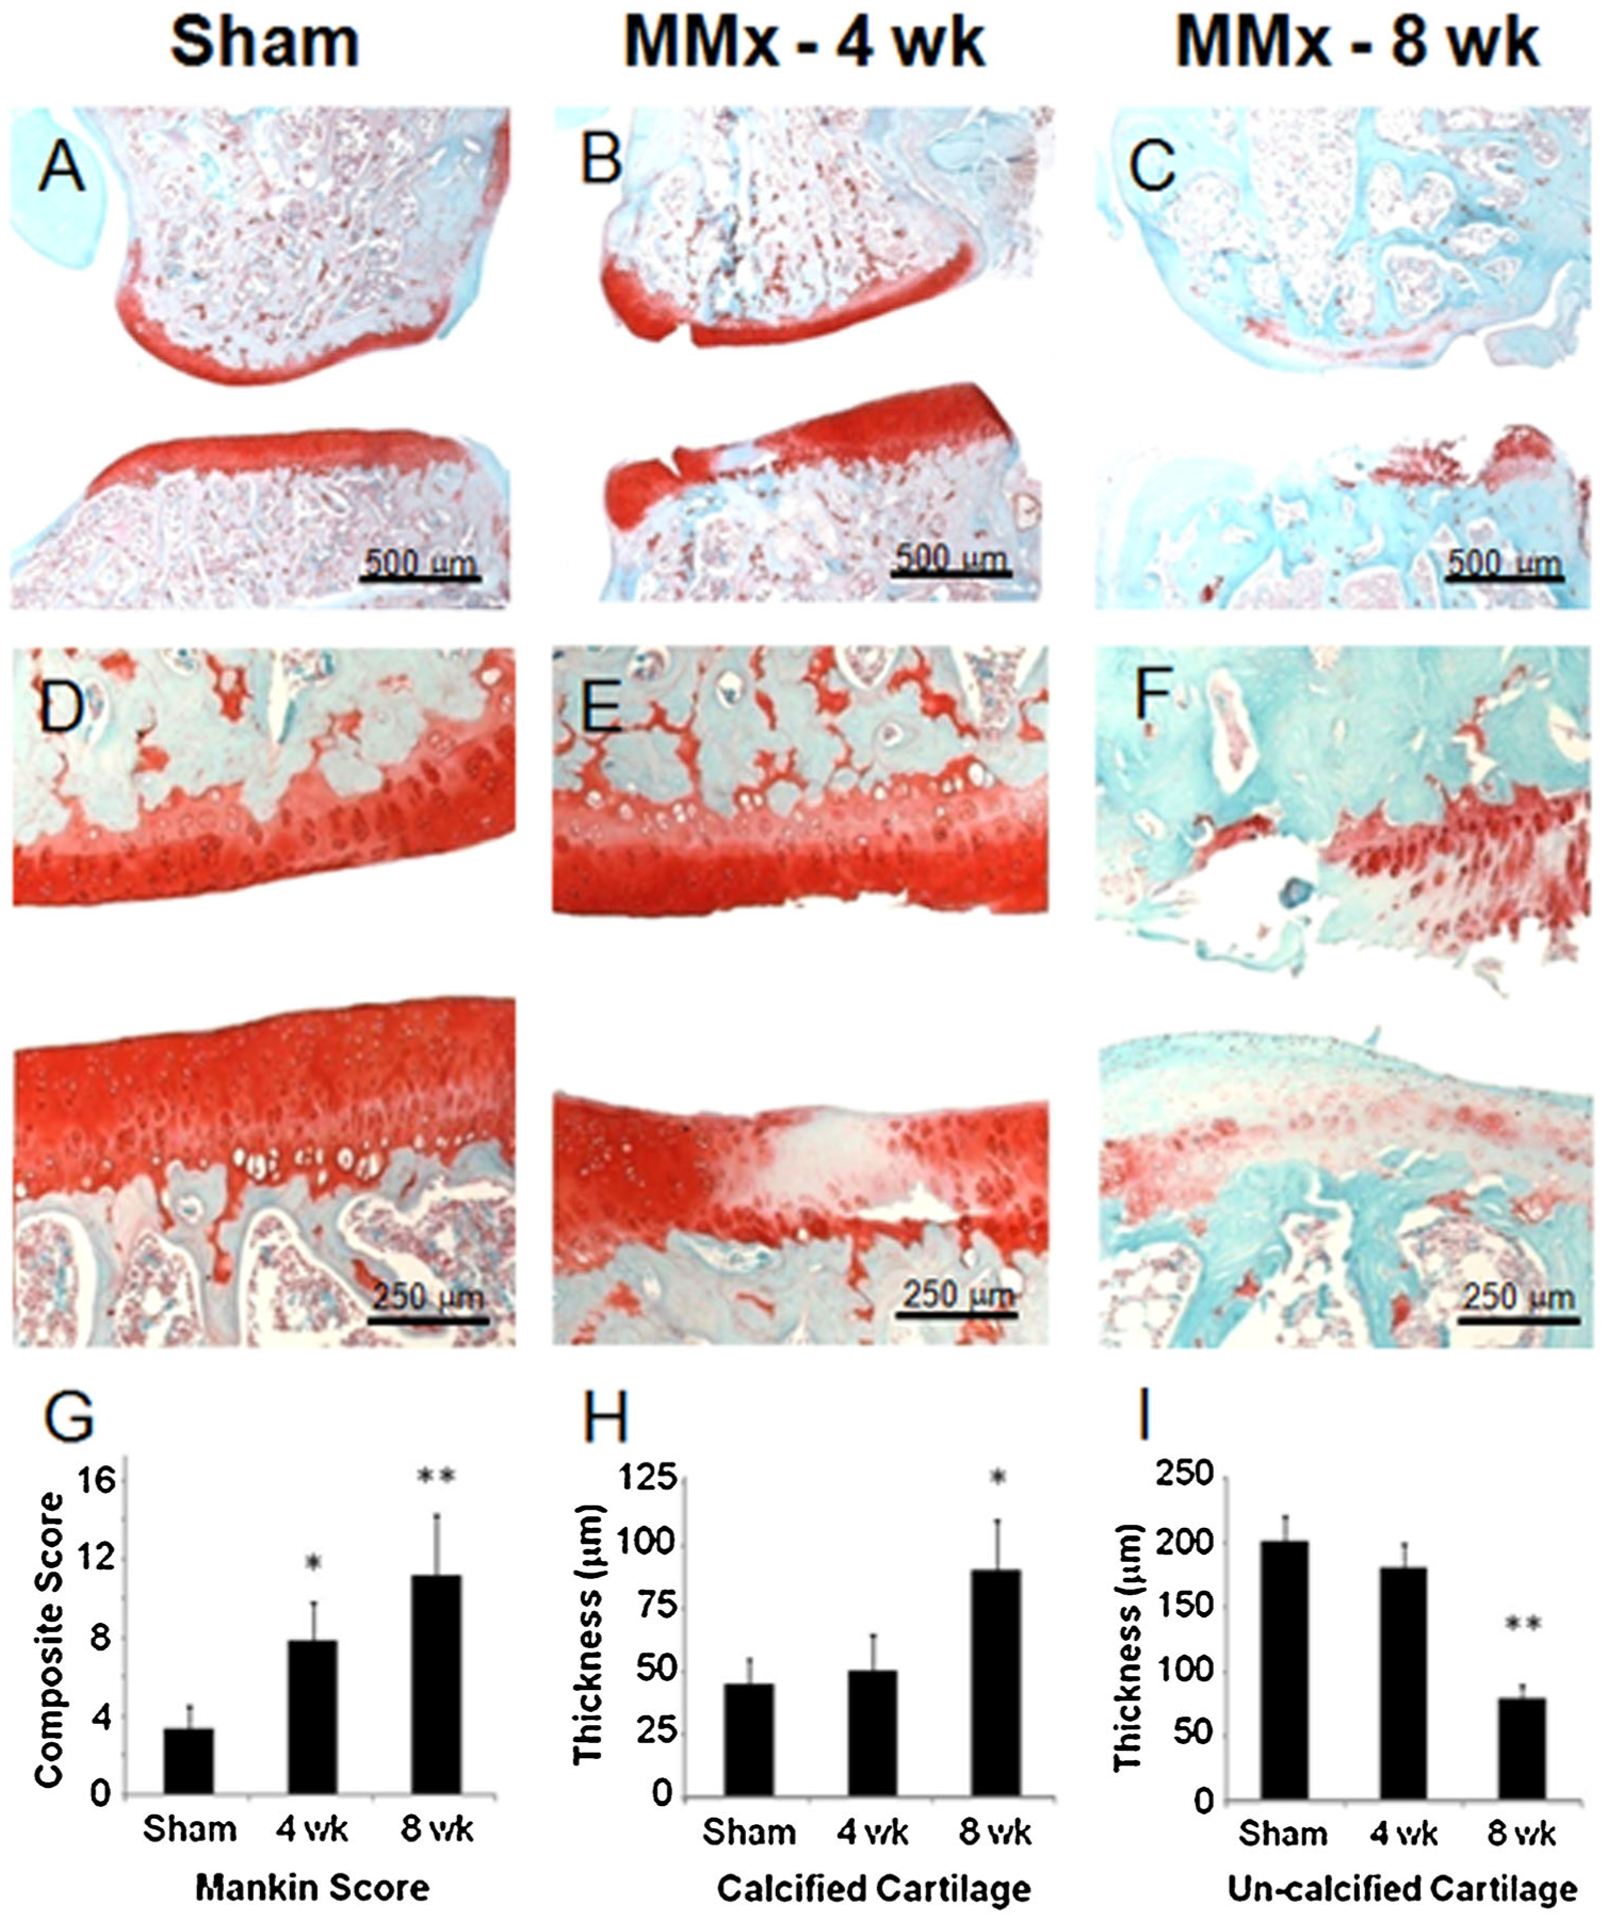
Histological analysis of arthritic changes and quantitative assessment of cartilage thickness in the rat meniscal transection model of osteoarthritis. Representative micrographs of the medial knee compartment stained with Safranin O. Sham operated knees showed no arthritic changes evident at low or high magnification (A and D, respectively). Osteophytes and chondrophytes are commonly observed in the periarticular region and increase in size and severity from 4 to 8 weeks post-operatively (B and C, respectively). Cellular changes consistent with OA are depicted at higher magnification (E and F). The semiquantative modified Mankin scores indicates that OA severity increases with time (G). Consistent with OA progression, increases in calcified cartilage thickness (H) and decreases in un-calcified cartilage thickness were also observed. Statistical significance is indicated as *p < 0.05 compared to sham and **p < 0.05 compared to 4-week time point.
