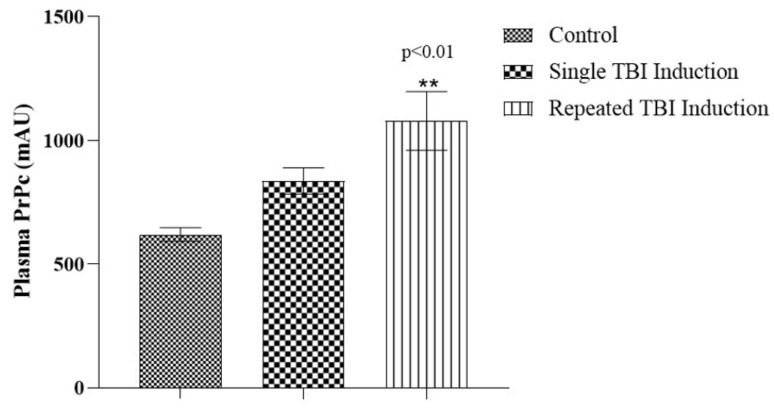
Figure 4.
Plasma PrPc levels in TBI mice following single and repeated TBI induction. Bar diagram represents the level of PrPc in plasma (mAU); values are expressed as mean ± SEM; n = 6; mean differences between the groups were analyzed using one way ANOVA followed by Tukey’s multiple comparison test as post hoc in Graphpad prism software (v 8.0); ** indicate p < 0.01 vs. control mice.

