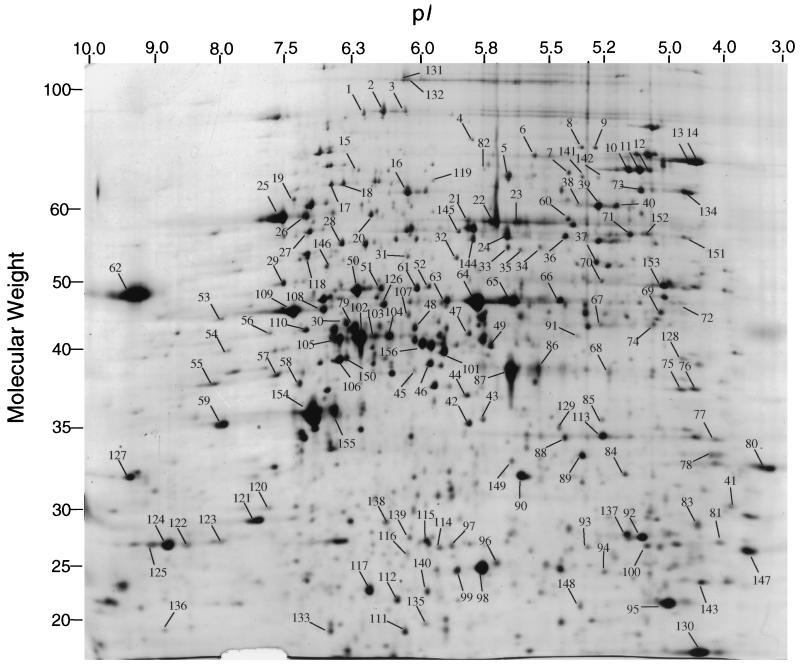
FIG. 2.
2D silver-stained gel of the proteins in yeast total cell lysate. Proteins were separated in the first dimension (horizontal) by isoelectric focusing and then in the second dimension (vertical) by molecular weight sieving. Protein spots (156) were chosen to include the entire range of molecular weights, isoelectric focusing points, and staining intensities. Spots were excised, and the corresponding protein was identified by mass spectrometry and database searching. The spots are labeled on the gel and correspond to the data presented in Table 1. Molecular weights are given in thousands.

