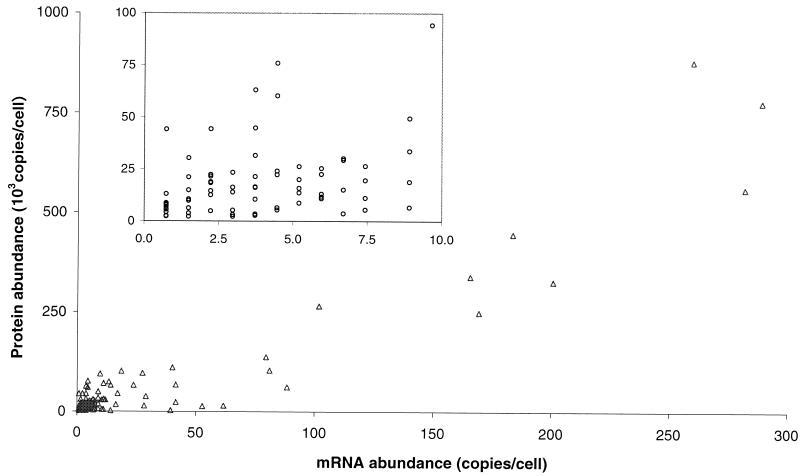
FIG. 5.
Correlation between protein and mRNA levels for 106 genes in yeast growing at log phase with glucose as a carbon source. mRNA and protein levels were calculated as described in Materials and Methods. The data represent a population of genes with protein expression levels visible by silver staining on a 2D gel chosen to include the entire range of molecular weights, isoelectric focusing points, and staining intensities. The inset shows the low-end portion of the main figure. It contains 69% of the original data set. The Pearson product moment correlation for the entire data set was 0.935. The correlation for the inset containing 73 proteins (69%) was only 0.356.

