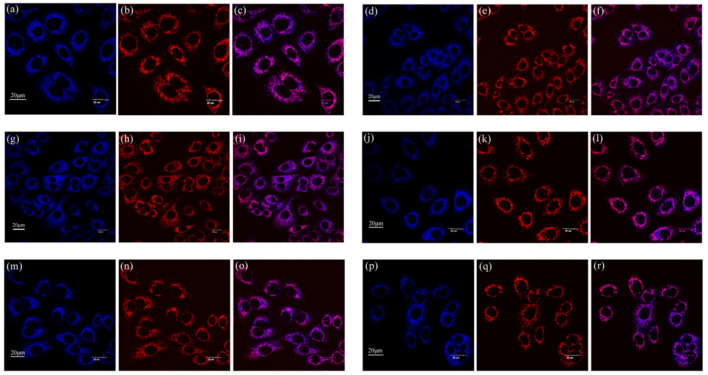
Figure 9.
Co-localized images of A549 cells incubated with compounds (a) 1, (d) 2, (g) 3, (j) 4, (m) 5, and (p) 6 (10 µM) and Mito Tracker Red (200 nM) (b) 1, (e) 2, (h) 3, (k) 4, (n) 5, and (q) 6 for 30 min. The merged images co-cultured with (c) 1, (f) 2, (i) 3, (l) 4, (o) 5, (r) 6. The excitation wavelength of compounds 1–6 was 405 nm. The excitation wavelength of Mito Tracker Red was 578 nm.

