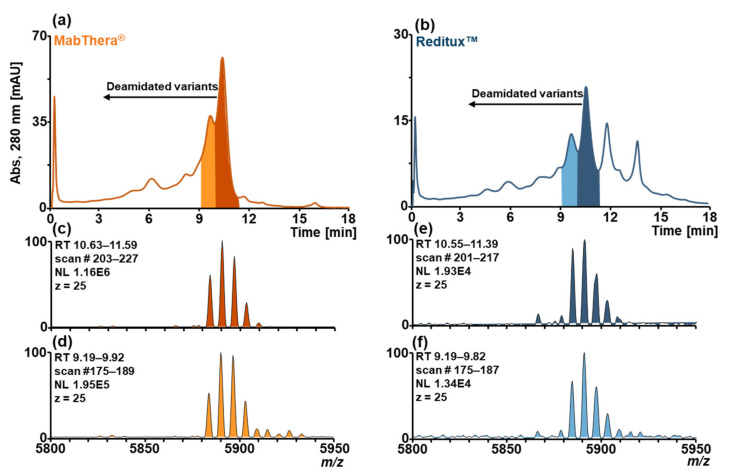
Figure 2.
SCX-HPLC-MS chromatograms of forced deamidated (a) MabThera® (orange) and (b) Reditux™ (blue). Additional chromatographic peaks due to deamidated variants are indicated. Magnification of charge state 25+ of the mass spectrum associated with (c) the peak at RT 10.63–11.59 min of MabThera®, (d) the peak at RT 9.19–9.92 min of MabThera®, the peak at RT 10.55–11.39 min of Reditux™, and (f) the peak at RT 9.19–9.82 min of Reditux™. No clear differences can be observed between the spectra (c,d) and (e,f) due to the inability of MS to resolve the mass shift of deamidation (≈1 Da) at the intact level.

