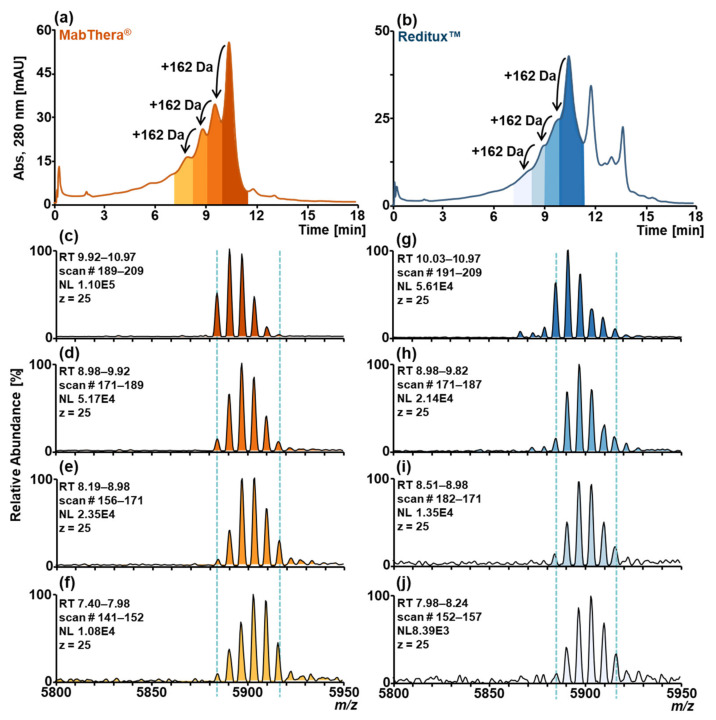
Figure 3.
SCX-HPLC-MS chromatograms of forced glycated (a) MabThera® (orange) and (b) Reditux™ (blue). Additional chromatographic peaks due to glycated variants are indicated by arrows (+162 Da). Magnification of charge 25+ of mass spectrum associated with (c) peak at RT 9.83–10.97 min of MabThera®, (d) peak at RT 8.98–9.92 min of MabThera®, (e) peak at RT 8.19–8.98 min of MabThera®, (f) peak at RT 7.40–7-98 min of MabThera®, (g) peak at RT 10.03–10.97 min of Reditux™, (h) peak at RT 8.98–9.82 min of Reditux™, (i) peak at RT 8.51–8.98 min of Reditux™, (j) peak at RT 7.98–8.24 min of Reditux™. A shift of 162 Da in the glycosylation pattern due to the glycation bias can be observed going to the more acidic variants (spectra c–f and g–l).

