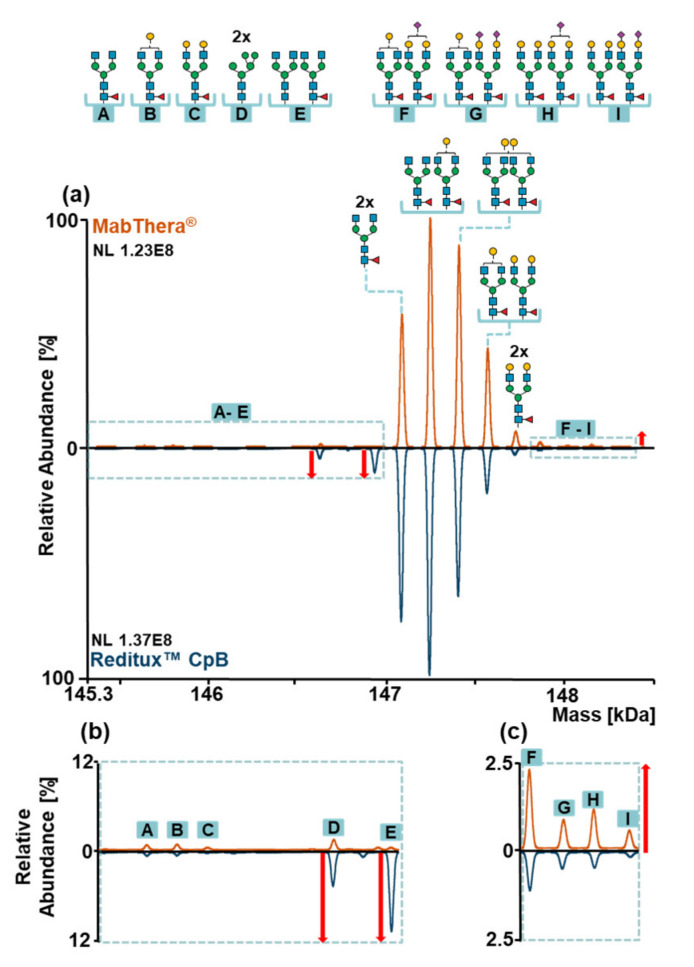
Figure 4.
(a) Mirror plot of the deconvoluted mass spectra of MabThera® (orange) and Reditux™ (blue) after carboxypeptidase B treatment (CpB). Glycan structures of main glycoforms are reported above the peaks, while minor glycoforms are indicated with the letters A–I. Differences in relative abundances of glycoforms can be observed between MabThera® and Reditux™. (b) Magnification of minor glycoforms A–E. Red arrows indicate an increased amount of oligomannose (D) and afucosylated (E) glycoforms in Reditux™ compared to MabThera®. (c) Magnification of minor glycoforms F–I. The red arrow indicates an increased amount of sialylated glycoforms (F–I) in MabThera® compared to Reditux™. Annotations of the spectra are reported in Tables S2 and S5. Glycan structures, names, and compositions are collected in Table S1.

