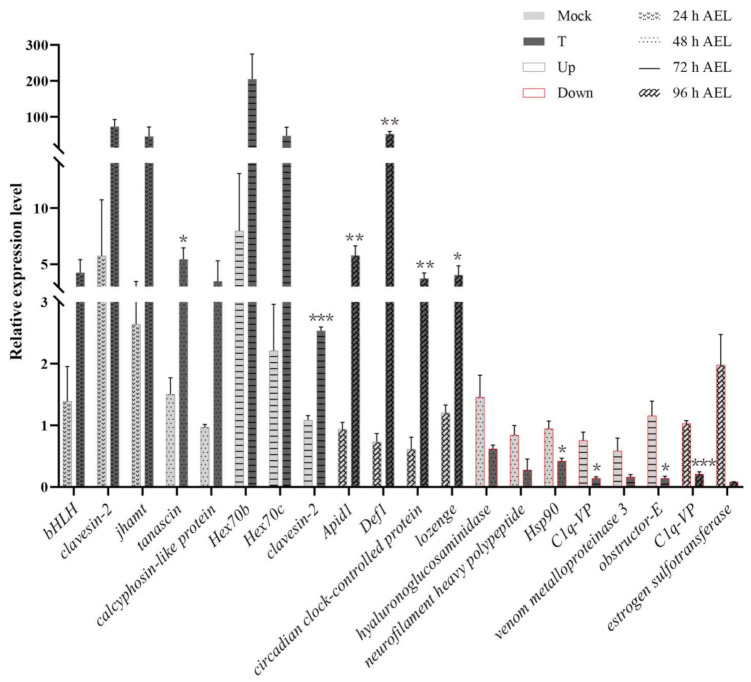
Figure A2.
Expression of DEGs from RNA-Seq. Twenty genes were selected and their gene expressions were examined by qPCR. Consistent with RNA-Seq analysis, the up-regulated DEGs were expressed higher in samples of the treatment group than mock-treated specimens; the down-regulated DEGs were expressed higher in specimens of the mock-treated than the treatment group. Actin was used as the reference gene. Mock means mock-treated samples injected with sgRNA. T means treatment specimens injected with the mixture of sgRNA and Cas9 nuclease. Up means up-regulated in the treatment group. Down means down-regulated DEGs. The results are given as the mean ± SEM of the samples and are expressed as the fold change in mRNA expression. *, p < 0.05; **, p < 0.01; ***, p < 0.001.

