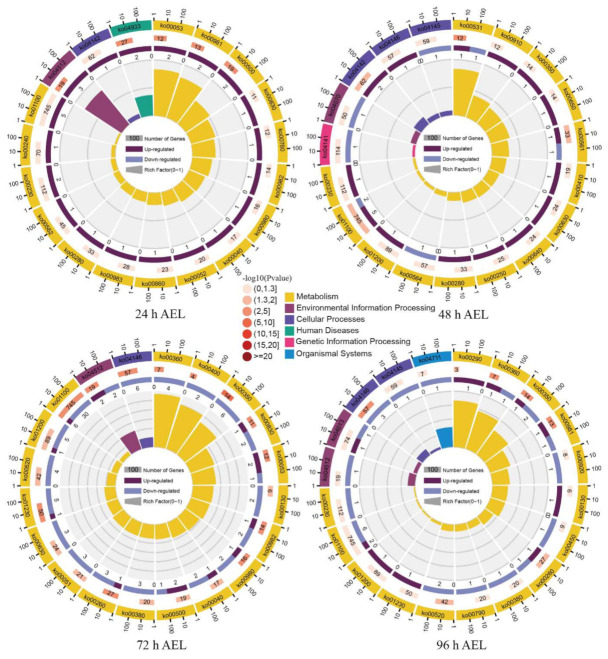
Figure A5.
The KEGG pathway enrichment analysis of DEGs. The outermost layer represents the KEGG A class. From outside to inside, the second layer contains the numbers of DEGs with significant enrichment. The third layer shows the up-regulation and down-regulation of the DEGs. The fourth layer is the enrichment factor in each pathway.

