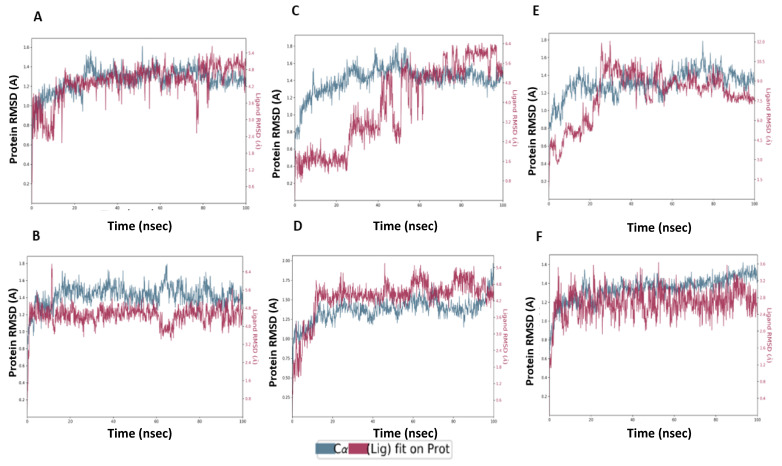
Figure 10.
The root mean square deviations (RMSD) plots of compounds M1–5 compared to Compound 13 with human TMPRSS2 (PDB ID: 2OQ5). (A) RMSDs of Compound 13. (B) RMSDs of M3. (C) RMSDs of M1. (D) RMSDs of M2. (E) RMSDs of M4. (F) RMSDs of M5. Green represents the protein backbone fluctuations, while the red represents the ligand fluctuations.

