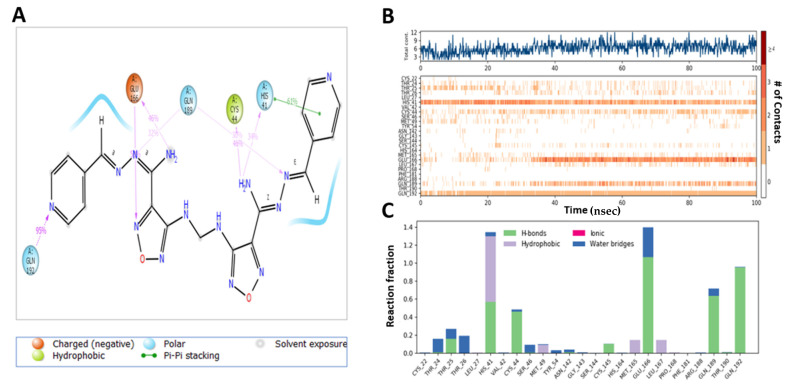
Figure 12.
Interaction diagram of M3 with Mpro observed during the molecular dynamic simulation. (A) The protein–ligand interaction diagram. (B) The top panel showed the specific contact of Mpro protein with M3 in each trajectory course, the bottom panel showed the amino acid residues that interact with the ligand in the trajectory time frame. The residues making more than one contact were shown in a darker color shade. (C) Schematic diagram of ligand interaction with the amino acid residues of protein during MD simulation.

