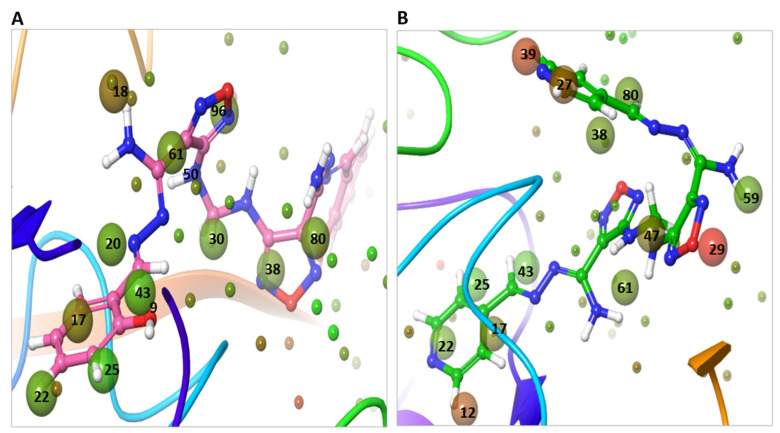
Figure 16.
WaterMap analysis of the hydration sites of TMPRSS2 binding pocket with the docked pose of compounds. (A) The overlay and displacement of unstable and replaceable water with Compound 13. (B) The overlay and displacement of unstable and replaceable water with M3. The hydration sites were shown with small spheres. The color spectrum ranged from red (most unfavorable) to green (least unfavorable).

