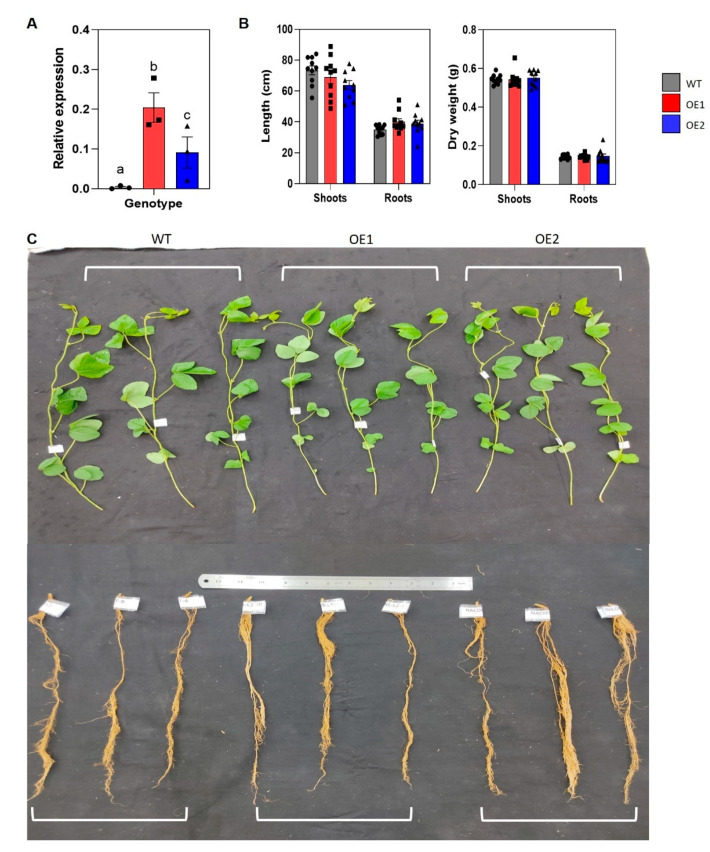
Figure 2.
Expression of GmNAC085 in 21-day-old GmNAC085-transgenic plants (OE1 and OE2) and their phenotype under normal growth conditions. (A) GmNAC085 expression levels in wild-type (WT), OE1 and OE2 plants (n = 3). (B) Phenotypic parameters, including shoot length, root length, shoot dry weight and root dry weight (n = 10). (C) Representative pictures of shoots and roots of the WT and transgenic plants. Each value represents the mean ± SE. Significant differences analyzed by ANOVA and Tukey’s honestly significant difference test were indicated by different letters (p < 0.05).

