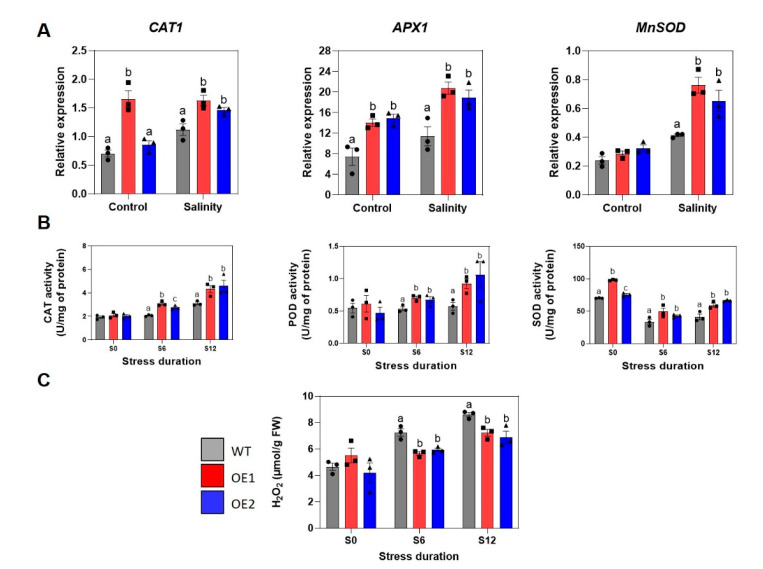
Figure 4.
Evaluation of components of the reactive oxygen species-scavenging system in transgenic (OE1 and OE2) and wild-type (WT) plants under control and salinity conditions (S6 and S12 for 6-day and 12-day treatments, respectively). (A) Expression profile of antioxidant enzyme-encoding genes. (B) Enzymatic activities of catalase (CAT), peroxidase (POD) and superoxide dismutase (SOD). (C) Endogenous hydrogen peroxide (H2O2) content. Each value represents the mean ± SE (n = 3). Significant differences among the genotypes in each treatment that were analyzed by ANOVA and Tukey’s honestly significant difference test were indicated by different letters (p < 0.05).

