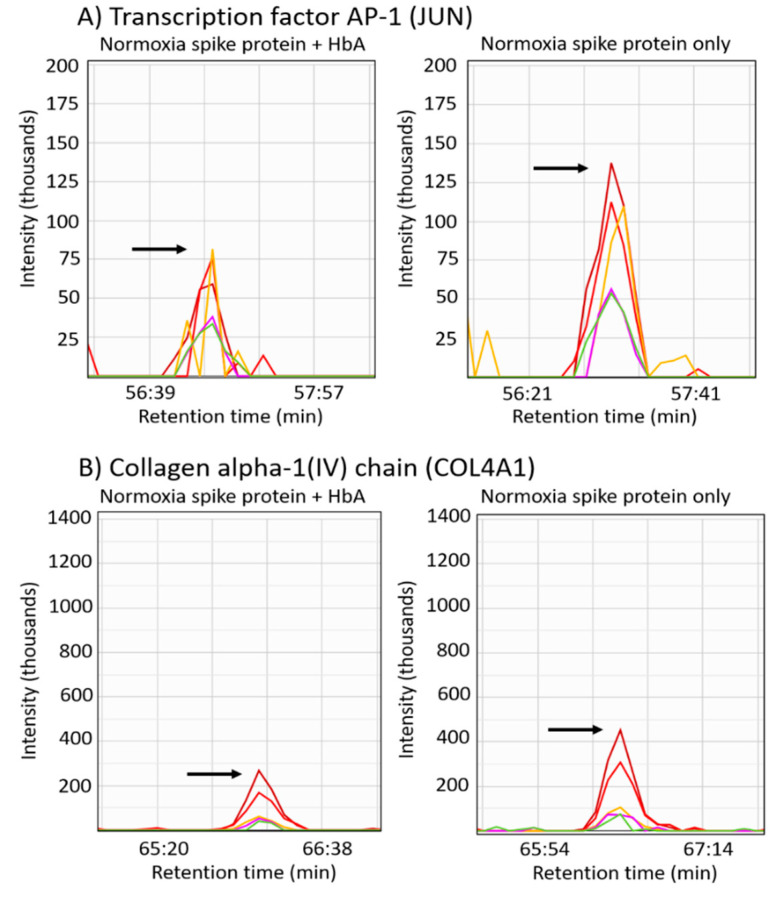
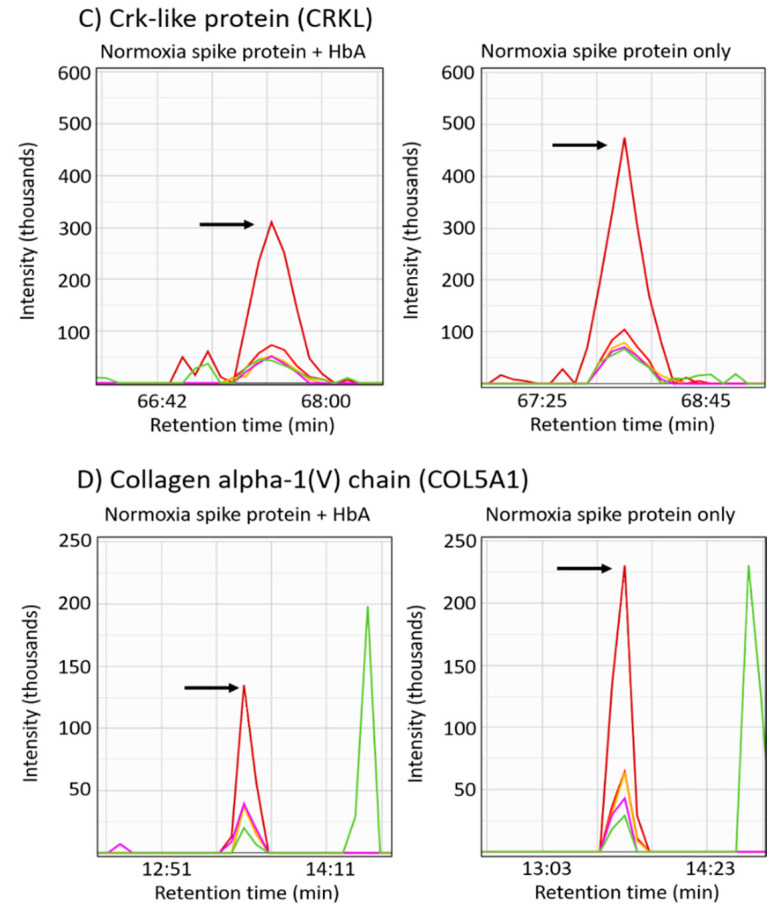
Figure 7.
Proteins in the focal adhesion pathway were downregulated in normoxic S1 protein- and HbA-treated cells relative to S1 protein-only-treated cells. (A–D) Representative LC–MS/MS chromatograms are shown for b- and y-type sequencing fragment ions used to quantify peptides from each of the focal adhesion pathway downregulated proteins observed. The arrows in each chromatogram point to the peptide apex intensity. (A) The peptide AQNSELASTANMLREQVAQLK corresponding to the precursor m/z 768.07 (+3), (B) the peptide IVPLPGPPGAEGLPGSPGFPGPQGDR with precursor m/z 822.76 (+3), (C) the peptide TLYDFPGNDAEDLPFK with precursor m/z 921.43 (+2), and (D) shows the peptide DAQLSAPTK with precursor m/z 930.49 (+1).


