Figure 1.
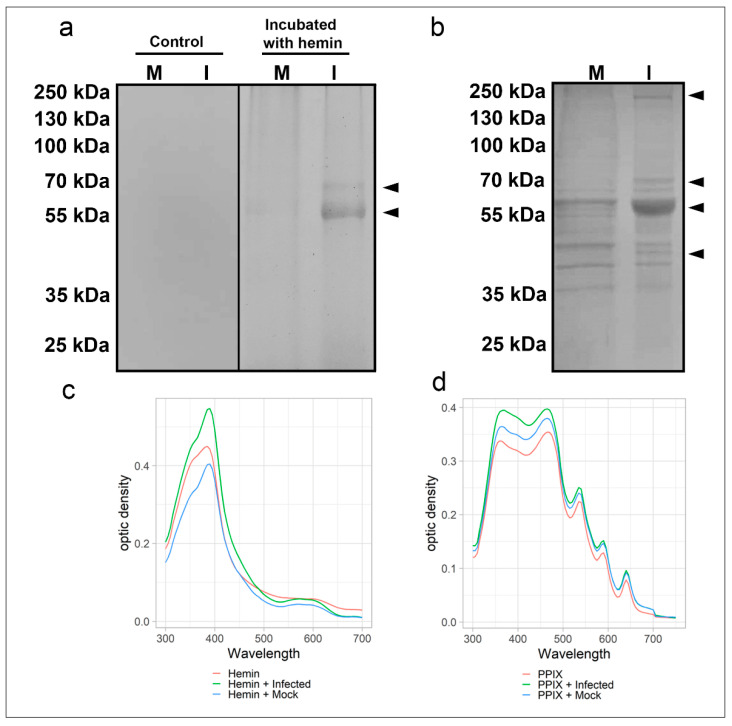
Heme-binding proteins in extracts from SARS-CoV-2 infected and non-infected Vero cells along with a spectroscopic binding analysis in solution. Total protein extracts (20 µg) from virus-infected (I) and mock-infected (M) were: (a) incubated with 300 µM of hemin for 1 h at 25 °C, resolved by SDS-PAGE, renatured and exposed to TMB in-gel to reveal hemin or (b) resolved by SDS-PAGE, transferred to NM and incubated with hemin (2 µM) for 1 h before revealing hemin-protein complexes by DAB. Arrowheads indicate bands of hemin-protein complexes. UV-visible spectra of hemin (c) alone (10 µM, red) or in total protein extracts (20 µg) of virus-infected Vero cells (green) and mock-infected cells (blue). UV-visible spectra of PpIX (d) alone (5 µM, red) or in total protein extracts (20 µg) of virus-infected Vero cells (green) and mock-infected cells (blue). Changes in the Soret peak and Q-bands are observable. Data are representative of two independent experiments. Source: data are provided as a source data file.

