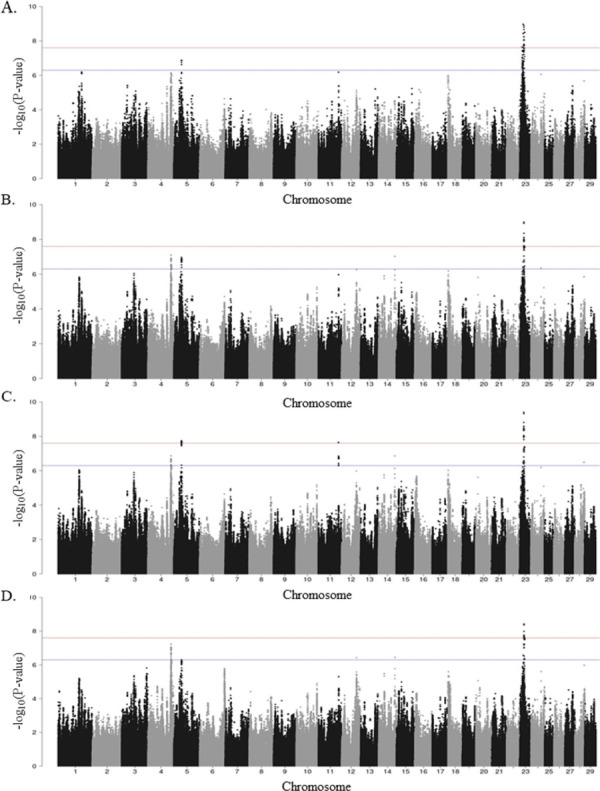
Fig 2. Manhattan plots showing–log10(P-values) of association between every single SNP and phenotype.

Each dot represents the result from the test association for a single SNP. Animals were considered cases when they were positive to all the tests and controls when they were negative to any (+/), or all of them (+/-). Chromosomes localization of the SNPs associated with ELISA-tissue culture-tissue PCR (+/-) (A), ELISA-tissue culture-tissue PCR (+/) (B), ELISA-tissue culture (+/) (C), and ELISA-tissue PCR (+/) (D) is indicated on the x-axis. The horizontal red line is drawn at–log10 (2.5 × 10⁻⁸), and the horizontal blue line at–log10 (5 × 10⁻⁷) to show the high level of significance.
