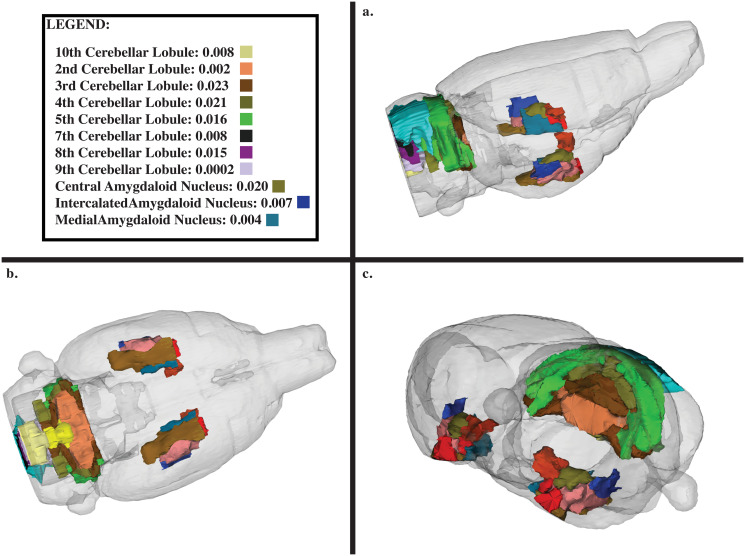
Fig 4. Neuroanatomical display of the amygdala and 10 cerebellar lobules.
(a) Side profile view of rat brain. (b) ventral view of rat brain. (c) Side profile view of rat brain of anterior rostral brain. Legend displays only regions that were statistically significant, with both the p-value and the corresponding color represented on the 174-region neuroanatomical atlas.

