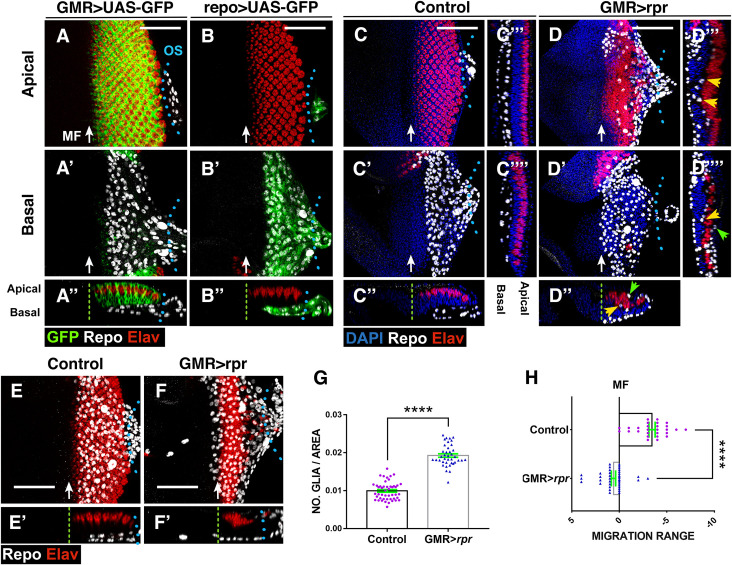
Fig 1. Response of glia to neuronal apoptotic induction in the eye discs.
(A–F’) Third instar eye discs stained with anti-Elav (Photoreceptors in red), anti-Repo (glial cells in white), and the nuclear marker DAPI (blue). (A–D) Apical/middle layers of the eye disc epithelium. (A’–D’) Basal layers of the eye discs. (A”–D”, E’–F’) The X–Z projections show cross sections perpendicular to the furrow of the eye discs of panels A–D (A”–D”) and E–F (E’–F’). (C”’–C”” and D”’–D””) Transverse sections parallel to the furrow of discs shown in C (C”’–C””) and D (D”’–D””). (A–A”) Eye disc showing the expression of UAS-GFP (green) under the control of GMR-Gal4. Glial nuclei (anti-Repo in white) are located in the basal layer of the eye disc, and they do not express UAS-GFP. (B–B”) The expression of UAS-GFP (green) under the control of repo-Gal4 is restricted to glial cells. (C–C””) In control discs, subretinal glial cells are always located in the basal layer of the disc. (D–D””) In damaged UAS-rpr/+ GMR-Gal4, tub-Gal80ts eye discs glial cells are not only in the basal layer of the disc but also in the middle and apical layers. This is most clearly seen in transverse sections shown in (D”–D””). Arrowheads indicate glial cells located in apical (green arrowheads) and middle (yellow arrowheads) layers of the discs (D”–D””). Note that glial cells in the medial layer directly contact photoreceptors. (E–F’) Projections of confocal images of the basal layers of third instar control (GMR-Gal4 tub-Gal80ts) (E) and damaged (UAS-rpr/+ GMR-Gal4, tub-Gal80ts) (F) eye showing the relative position of the anterior border of glial migration with respect to the anterior most row of photoreceptors. In damaged discs, the anterior border of glial migration lays 2–4 row in front of the MF (green dashed line). (G) Graph shows the density of glial cells (number of glial cells/area occupied by glial cells in μm2) in control and damaged UAS-rpr/+ GMR-Gal4 tub-Gal80ts /+ discs. (H) Graph shows the relative position of the anterior border of glial migration with respect to the anterior most row of photoreceptors (0 indicates the position of this row) in control and damaged UAS-rpr/+ GMR-Gal4 tub-Gal80ts eye disc. Error bars represent SEM. Statistical analysis is shown in Table A in S1 Text. In this and all subsequent figures, anterior is to the left. Blue dotted lines indicate the approximate limit between eye disc and optical stalk (os). The green dashed line indicates the approximate position of the MF. Scale bars, 50 μm. The numerical data used in this figure are included in S1 Data. GMR, glass multiple reporter; MF, morphogenetic furrow; rpr, reaper; SEM, standard error of the mean.

