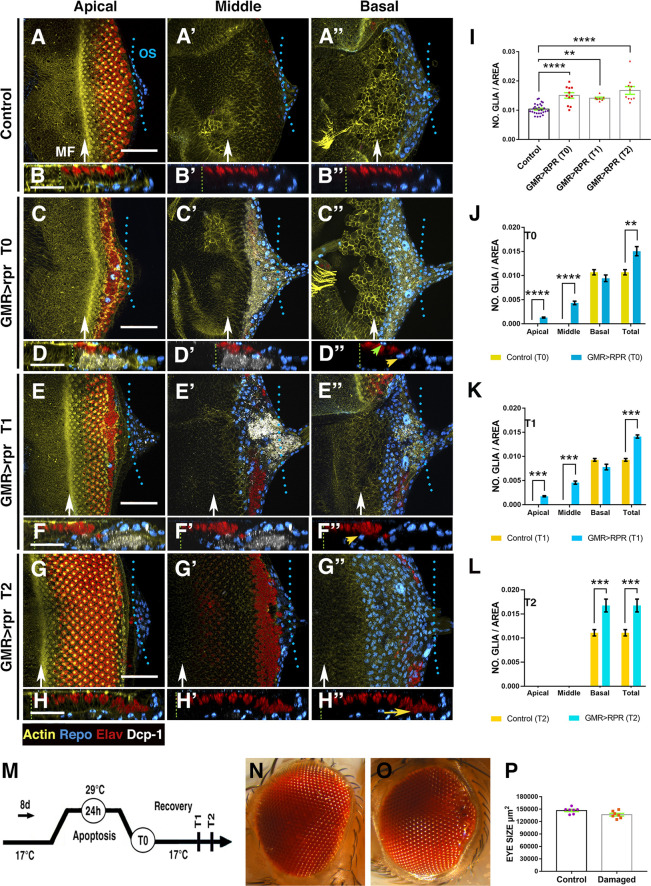
Fig 2. Overview of glial response at different times after apoptotic induction in the eye discs.
(A–H”) Third instar eye discs stained with anti-Elav (red) and anti-Repo (blue), the apoptotic marker Dcp-1 (grey), and Phalloidin to visualise F-actina (yellow). Control undamaged disc (GMR-Gal4 tub-Gal80ts) (A–B”) and UAS-rpr/+; GMR-Gal4 tub-Gal80ts/+ eye discs analysed at different times after inducing apoptosis (C–H”). (A, C, E, and G) Apical, (A’, C’, E’, and G’) middle, and (A”, C”, E”, and G”) basal layers of the eye disc epithelium. (B–B”, D–D”, F–F”, and H–H”) X–Z projections show a cross section of the eye discs epithelium perpendicular to the furrow of the discs shown in A (B–B”), C (D–D”), E (F–F”), and G (H–H”). (I) Bar charts show the average density of glial cells of discs analysed at different times after apoptotic induction. (J–L) Bar charts show the average density of glial cells and their apical/basal localisation of discs immediately after apoptotic induction T0 (J), discs analysed after 24 hours of recovering T1 (K), and discs examined after 48 hours of recovering T2 (L). In each graph is also shown the total density of glial cells for control (GMR-Gal4 tub-Gal80ts/+) and UAS-rpr/+; GMR-Gal4 tub-Gal80ts/+ eye discs. (M) Schematic diagram of the temperature shifts used in this experiment. (A–B”’) In control discs, subretinal glial cells are always localised in the basal layer of the eye disc. (C–D”) UAS-rpr/+; GMR-Gal4 tub-Gal80ts eye discs dissected and analysed immediately after ablation (T0). Apoptotic cells are located in the middle and basal layer of the discs, whereas glial cells appear in the middle (yellow arrowhead in D”) as well as apical planes (green arrowhead in D”) (D–D”). (E–F”) UAS-rpr/+; GMR-Gal4 tub-Gal80ts/+ eye discs analysed after 24 hours of recovering. The new rows of photoreceptors that are specified during the recovery time are not affected. Note that most cellular debris was displaced towards the posterior region of the discs and even inside the optic stalk. The average density of glial cells in these discs is still higher than in control discs (K). We find a high number of glial cells in apical and middle layers of the discs (yellow arrowhead in F”). (G–H”) Damaged eye discs analysed after 48 hours of recovering. In these discs, we do not find apoptotic debris (in grey) (H–H”). In the posterior region of the disc, we observed very disorganised photoreceptors, which are located in the basal layer and that likely correspond to the photoreceptors that did not die after overexpressing UAS-rpr (yellow arrow in H”). (N–O) Adult control eye (N) and an eye derived from damaged eye discs (O). (P) Bar charts show the average size of control eyes and adult eyes developed from damaged discs. Statistical analysis is shown in Table B in S1 Text. In this and all subsequent figures, white arrows indicate the approximate position of the MF. Scale bars, 50 μm. The numerical data used in this figure are included in S1 Data. GMR, glass multiple reporter; MF, morphogenetic furrow; rpr, reaper.

