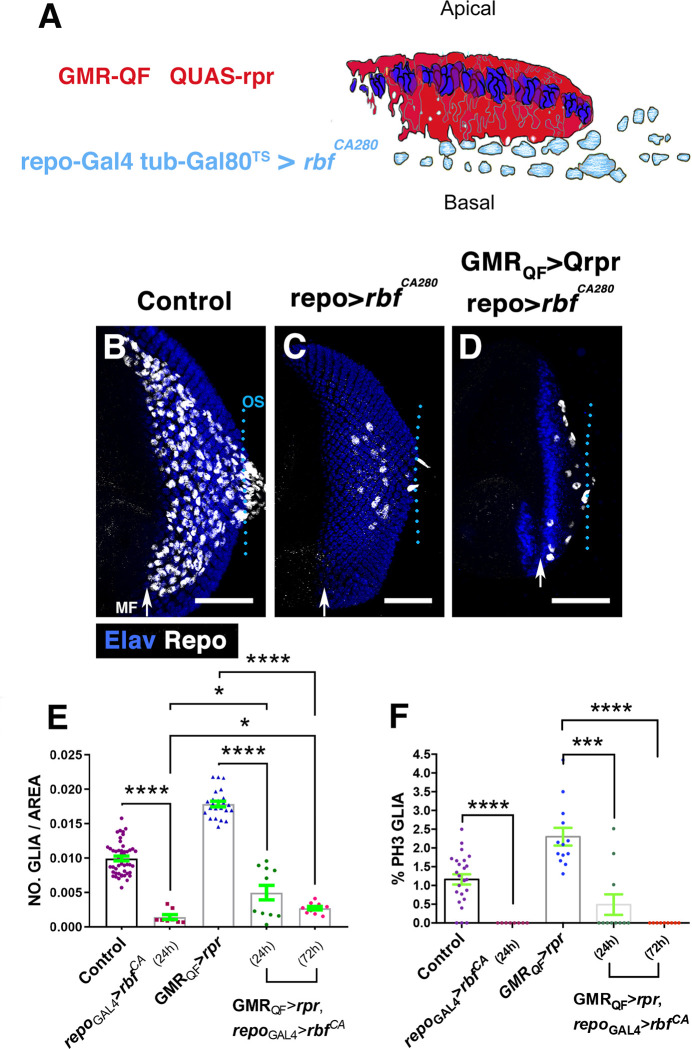
Fig 3. Overexpression of rbfCA280 in glial cells reduces the number of glial cells observed after cell death induction.
(A) The schematic illustration represents a transverse section of an eye disc where the region marked in red (expression domain of GMR-QF) corresponds to the area of the discs that has been damaged using QUAS-rpr GMR-QF. Glial cells are indicated in light blue. repo-Gal4 drives the expression of UAS-rbfCA280 under the control of UAS specifically in glial cells. (B–D) Third instar eye discs stained with anti-Repo (white) and anti-Elav (blue). Control undamaged GMR-QF; tub-Gal80ts repo-Gal4 eye disc (B), tub-Gal80ts/+; repo-Gal4/UAS-rbfCA280 (C) and GMR-QF; tub-Gal80ts/+; repo-Gal4/UAS-rbfCA280 disc (D). The overexpression of UAS-rbfCA280under the control of repo-Gal4 reduces the number of glial cells in undamaged (C) and damaged eye discs (D). (E) The graph represents the glial density of discs shown in B–D (Control, repoGal4-rbf24hrs, GMRQF-rpr, GMRQF-rpr repo Gal4-rbf24hrs, and GMRQF-rpr repoGal4-rbf72hrs). (F) The graph shows the percentage of glial cells in mitosis (PH3 positive). Statistical analysis is shown in Table C in S1 Text. Error bars represent SEM. Scale bars, 50 μm. The numerical data used in this figure are included in S1 Data. GMR, glass multiple reporter; rpr, reaper; SEM, standard error of the mean.

