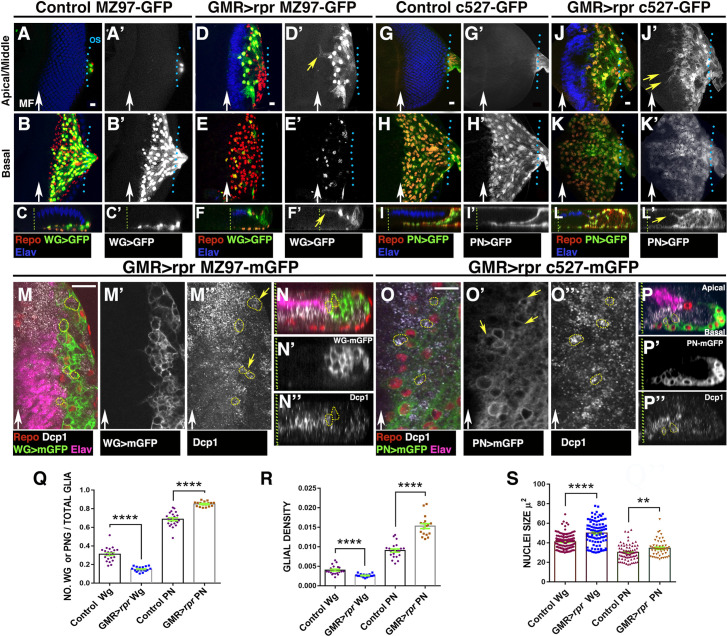
Fig 4. WG and PN cells change their morphology in response to apoptotic induction in the retinal region.
(A–L) Third instar eye discs stained with anti-Elav (blue) and anti-Repo (red). (A–F’) Mz97-Gal4 driving expression of UAS-GFP (green A–C and D–F and grey A’–C’ and D’–F’) reveals WG cells in control UAS-GFP Mz97-Gal4; QUAS-rpr (A–C’) and in damaged GMR-QF; UAS-GFP Mz97-Gal4; QUAS-rpr (D–F’) discs. (G–L’) c527-Gal4 drives expression of UAS-GFP (green G–I and J–L and grey in G’–I’, J’–L’) in PN glial cells in control UAS-GFP c527-Gal4; QUAS-rpr (G–I’) and damaged GMR-QF; UAS-GFP c527-Gal4; QUAS-rpr eye discs (J–L’). (A–A’, D–D’, G–G’, and J–J’) Apical/middle layers and (B–B’, E–E’, H–H,’ and K–K’) basal layers of the eye disc epithelium. (C–C’, F–F’, I–I’, and L–L’) Orthogonal section perpendicular to the furrow through confocal stacks of the eye discs shown in A–K’. (A–F’) In control discs, we never find WG cells in the middle or apical layer of the discs (A–C’); however, in damaged discs, most WG cells are located in the apical region (D–F’ yellow arrow in F’). These cells extend large processes towards the damaged region (D–D’ and F–F’). Some of these projections go over photoreceptors (yellow arrow in F’). (G–L’) In damaged eye discs, some PN glial cells were located in the middle layers of the disc epithelium (compared J–L’ with control G–I’), and they send cellular projections towards the damage region (yellow arrows in J’ and L’). (M–P”) Third instar eye discs stained with anti-Elav (magenta), anti-Repo (red), and anti-Dcp-1 (grey). (M–N”) Mz97-Gal4 driving expression of UAS-mCD8-GFP (in green and grey in M’) reveals WG cells in damaged GMR-QF; UAS-mCD8-GFP Mz97-Gal4; QUAS-rpr discs. (O–P”) Damaged GMR-QF; UAS-mCD8-GFP c527-Gal4; QUAS-rpr eye discs showing the membranes of PN glial cells. Both glial cell types (WG and PN) have vesicles containing cellular debris labelled with anti-Dcp1 (yellow arrows in M” in WG and in O” in PN). (Q-S) Graphs showing ratio of WG and PN glial cells (number WG or PN glial cells/number Total glia) (Q), WG and PN glial density (R), and nuclei size (S). Scale bars, 10 μm. Statistical analysis is shown in Table D in S1 Text. The numerical data used in this figure are included in S1 Data. GMR, glass multiple reporter; PN, perineurial; rpr, reaper; WG, wrapping glia.

