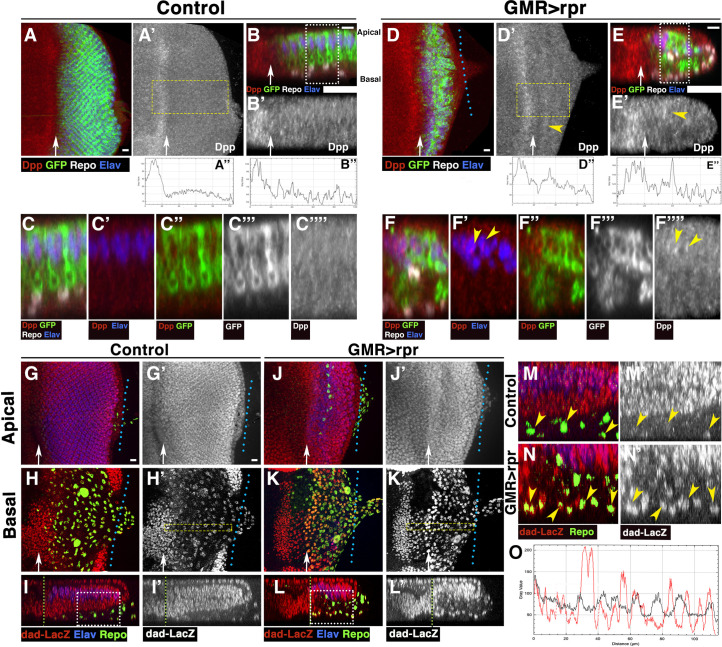
Fig 7. Dpp expression increases after inducing apoptosis in eye discs.
(A–F””) Third instar eye discs stained with anti-Elav (Blue), anti-Repo (white in A–C and D–F), GMR-Gal4 UAS-mCD8-GFP (green in A–C, C”, D–F, and F” and grey in C”’ and F”’), and anti Dpp (red in A–C, C’, C”, D–F, F’, and F” and grey in A’, B’, C””, D’, E’, and F””), in control tub-Gal80ts GMR-Gal4 UAS-mCD8-GFP (A–C””) and damaged UAS-rpr/+; GMR-Gal4 tub-Gal80ts/UAS-mCD8-GFP discs (D–F””). (B–B’ and E–E) Cross sections perpendicular to the furrow of the eye discs shown in A (B–B’) and D (E–E’). (A” and D”) Profile plot of the average Dpp intensity across the x-axis of the region highlighted by yellow rectangles shown in panels A’ (A”) and D’ (D”). (B” and E”) Profile plot of the average Dpp intensity of the panels shown in B’ (B”) and E’ (E”). (C–C”” and F-F””) Higher magnification images corresponding to the regions highlighted by white rectangles on the panels B (C–C””) and E (F-F””). (A–B”) In control eye discs, Dpp is expressed in a band of cells just anterior to the MF, and its expression levels decrease abruptly to a homogeneous low level behind the furrow. (D–E”) In damaged discs, some photoreceptors (positive staining for anti-Elav in blue, yellow arrowheads in F’) express higher levels of Dpp than the surrounding cells (yellow arrowheads in F’ and F””). In the basal region of the epithelia, where most of the dead cells are located, we only detect low levels of Dpp expression. (G–N’) Third instar eye discs stained with anti-Elav (blue), anti-Repo (green), and anti-B-galactosidase (red in G–N and grey in G’–N’) to reveal the activity of the dad-lacZ reporter in control (GMR-Gal4 tub-Gal80ts/+; dad-lacZ/+) (G–I’ and M–M’) and damaged UAS-rpr/+; GMR-Gal4 tub-Gal80ts/+; dad-lacZ/+ discs (J–L’ and N–N’). (G–G’ and J–J’) Apical layers of the eye disc epithelium. (H–H’ and K–K’) Basal layers of the eye disc epithelium. (I–I’ and L–L’) Y–Z projections show 2 cross sections perpendicular to the furrow in control (I–I”) and damaged (L–L’) discs. (M–M’ and N–N’) Higher magnification images corresponding to the regions highlighted by white rectangles on the panels I (M–M’) and L (N–N’). Note that the levels of expression of dad-lacZ in glial cells of damaged discs (yellow arrowheads in N and N’) are much higher than in control discs (yellow arrowheads in M–M’). (O) Profile plot of the average β-galactosidase intensity across the x-axis of the region highlighted by yellow rectangles shown in panel H’ (control discs, black line) and K’ (damaged discs, red line). Arrow indicates the approximate position of the MF. The levels of expression of dad-lacZ are similar in control and damaged discs in the region anterior to the MF, but in glial cells posterior to the MF, this reporter is expressed at higher levels in glial cells of damaged discs than in control glial cells. Scale bars, 10 μm. Dpp, Decapentaplegic; GMR, glass multiple reporter; MF, morphogenetic furrow; rpr, reaper.

